
Typical drive times to Salt Lake International Airport from Utah County AM Mid-Day PM Evening Day TT TT TT TT TT TT Increase TT Increase TT Increase TT Increase TT Increase Existing 0:55:56 0:47:55 0:54:08 0:45:43 0:50:37 2040 Build 1:00:57 0:05:01 0:50:39 0:02:44 1:08:33 0:14:24 0:45:50 0:00:06 0:55:54 0:05:17 2040 No-Build 1:09:56 0:14:00 0:51:53 0:03:58 1:16:49 0:22:41 0:45:44 0:00:00 1:00:19 0:09:42
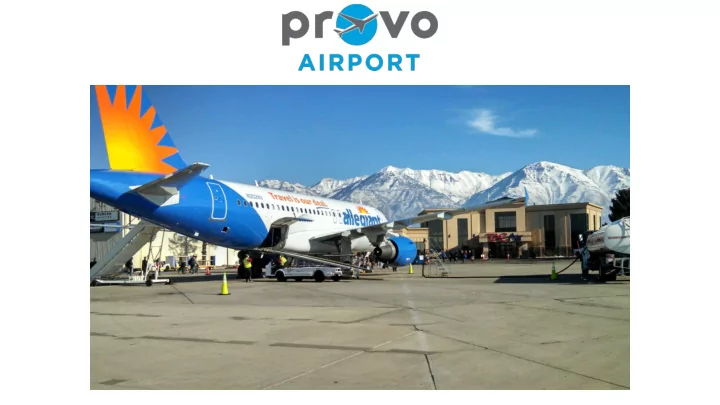
Runways are designed for A320/737 Sized Aircraft Provo Airport is the only airport in this region capable of commercial air service
Provo Airport – Filling a Regional Role • • Emergency Response Personnel and Equipment Provo RADAR Filled the “Utah County Blind Spot” • • Instrument Landing System (ILS) Air Traffic Control Tower • TSA Security Program • FAA Part 139 Certification
98,000 Passengers in 2017 100,000 estimated in 2018 (Utah’s 2nd Busiest Airport Enplanements/Operations) Current Facilities at Capacity
Historical Passenger Enplanements 120,000 Annual Enplanements 100,000 80,000 Allegiant Airlines 60,000 40,000 Frontier 20,000 Airlines 0 2005 2006 2007 2008 2009 2010 2011 2012 2013 2014 2015 2016 2017 2018
The PVU Catchment Area covers an area of eight counties south of Salt Lake County with a population of 754,300.
Top Markets Annual SLC % from PVU Potential PVU Market Passengers Area Passengers Los Angeles 710,030 15.1% 107,210 Denver 687,520 16.5% 113,440 Phoenix 548,200 16.5% 90,450 Long Beach 461,650 11.5% 53,090 Las Vegas 442,450 5.6% 24,780 Seattle/Tacoma 439,490 19.4% 85,260 San Diego 424,980 12.6% 53,550 New York (JFK) 371,170 17.7% 65,700 Dallas/Ft. Worth 357,550 12.0% 42,900 Chicago (ORD) 331,670 11.5% 38,140 Orlando 327,160 12.0% 39,260 Portland 322,650 11.9% 38,390 Oakland 312,060 17.8% 55,550 San Francisco 307,570 14.1% 43,370 San Jose 291,580 17.9% 52,190 Atlanta 290,420 10.3% 29,910 Boston 275,840 12.9% 35,580 Minneapolis 187,810 12.3% 23,100 Houston (IAH) 184,780 12.2% 22,540 Orange County 184,700 13.3% 24,560
Economic Factors Nonstop Metro Market Population County 2000 2017 Growth Markets Utah 368,540 606,425 64.5% Carbon 20,425 20,295 (0.7%) Provo 754,300 2 Duchesne 14,371 20,026 39.3% Juab 8,238 11,250 36.5% Milliard 12,405 12,863 3.7% Boise 790,363 22 Sanpete 22,763 30,035 31.9% Sevier 18,842 21,316 13.1% Colorado Springs 712,327 17 Wasatch 15,215 32,106 111.0% Total PVU 480,659 754,316 56.9% Eugene 369,520 10 Grand Junction 148,166 4 Reno 621,769 23 Spokane 721,873 16
Current Master Plan $8 Million FAA Grant Secured for 2020
Duncan Aviation 10 Acres of Concrete Ramp $8 Million Completed in 2018 Funded By: FAA EDA Provo City
Thank You
Recommend
More recommend