Trying to Outpace Log Collection with ELK Elasticsearch, Logstash, - PDF document
Trying to Outpace Log Collection with ELK Elasticsearch, Logstash, Kibana Time: 0:10 Hi everyone! Im Neil Schelly, a sysadmin up at Dyn in New Hampshire. Ive been focused for the last year on a project to get centralized logging in place
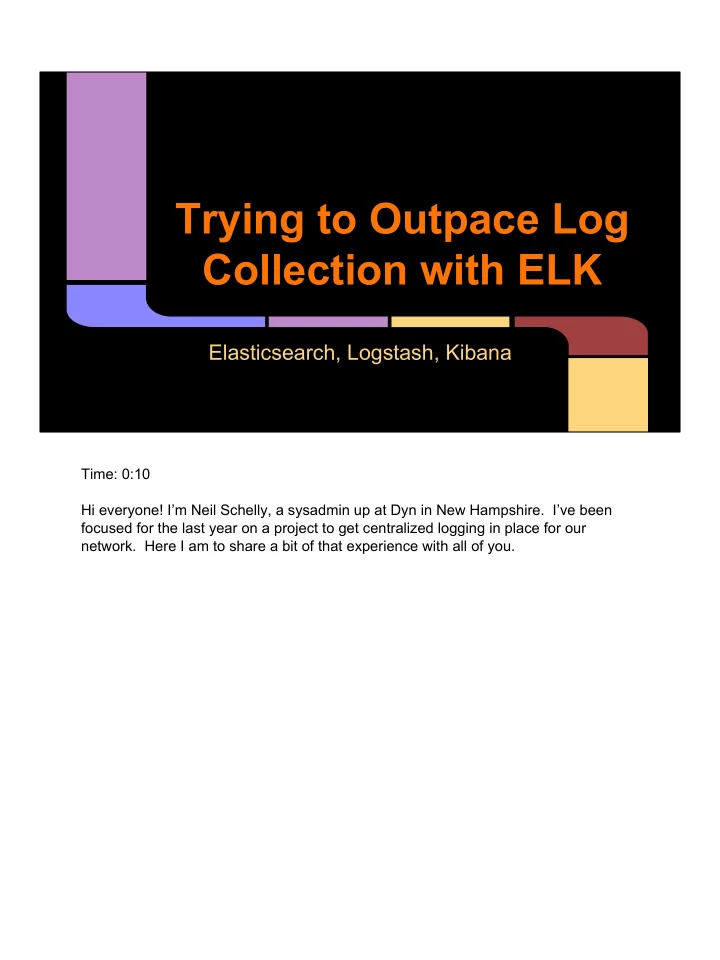
Trying to Outpace Log Collection with ELK Elasticsearch, Logstash, Kibana Time: 0:10 Hi everyone! I’m Neil Schelly, a sysadmin up at Dyn in New Hampshire. I’ve been focused for the last year on a project to get centralized logging in place for our network. Here I am to share a bit of that experience with all of you.
Disclaimer: Judgement Free Zone https://www.flickr.com/photos/coconinonationalforest/5376143040 Time: 0:15 Disclaimer: This is a judgement free zone, and we’ll get to why in a bit. I also have a penchant to browse Flickr for creative commons photos for presentation slides. I’m sorry in advance. I am not sure what this guy’s job is once he finds a loose chain, and I’m pretty sure he won’t be able to run fast enough if he does.
Please don’t judge me... ● Yay - we did something awesome! ● Embarrassed that it wasn’t already done. ● Hide in shame… ● … ● … ● Recognize that others probably haven’t done it either. ● … Give a presentation about it! Time: 0:15 ● Yay - we did something awesome! ● And then… We’re slightly embarrassed that it wasn’t already done. ● Kinda want to hide in shame. ● Hmm… ● Eventually recognize that others probably also haven’t done it yet. ● Presentation! I feel like there should be a bullet point for profit in here somewhere, but I haven’t figured out how that works yet.
The Problem https://www.flickr.com/photos/iangbl/338035861 Time: 0:05 Starting with a problem statement… We have logs. Lots of logs. Don’t care about all of them, but definitely care about some of them.
Logs are Useful ● SSH to the box ● Proudly exercise grep/awk/sed skills ● See what happened Time: 0:10 Logs are useful We know this. We’ve all administered something like this. SSH in, do some grep-fu, and we know what happened!
Servers are Useful ● Deploy more servers ● Now logs are hard ● Rsync to the rescue! ● Proudly exercise grep/awk/sed skills ● See what happened Time: 0:10 Multiple servers are also useful. But the same approach can work well with some rsync thrown in. The magic of rsync only buys so much time before...
Lots of Servers are Useful ● Deploy more servers, clouds, the Internet of Things, ephemeral entities, IaaS, etc ● Now logs are hard again. ● SSH? ...#(*@#! ● rsync? ...#(*@#! ● grep? ...#(*@#! ● Wonder what happened Time: 0:15 Then we moved on to more servers, clouds, the Internet of Things, ephemeral entities, IaaS, etc… Complex systems are more complex. Logs got hard again. At this point, we just end up wondering what happened.
Justification “If you can’t convince them, confuse them.” - Harry S. Truman Time: 0:05 So we know we want to create a centralized place to monitor the whole system. How do you justify it? In case President Truman’s advice doesn’t work for you, I’ll show what worked for us.
Technical Case Justification ● Better visualization of trends ● Easier searching for errors ● Historical perspective of suspicious events ● Pretty graphs and charts Time: 0:15 The technical case is easiest. Never underestimate the value of pretty graphs and charts. We had all these justifications long before this project got approval to happen. It doesn’t make money. It doesn’t scale the product to support more people, which would make money. It helps the people support the product more easily as more customers use the system. That’s pretty indirect to the folks who sign the checks.
Business Case Justification ● Security Attestations and Compliances ○ Shorten the sales cycles for customers who ask about our security policies ○ Open new markets Time: 0:20 Here’s how we convinced folks to sign checks. This is still a judgement-free zone in case you forgot. ● Security attestations and compliances generally require you to prove you are paying attention to what’s going on with your systems. Auditors are really impressed by centralized logging systems. ● Shorten sales cycles when customers ask questions about security policies ● Open new markets to customers who demand certain certifications These justifications may work for you. YMMV.
The State of the Logs https://www.flickr.com/photos/alanenglish/3509549894
The Prototype https://www.flickr.com/photos/laffy4k/404321726 Time: 0:06 So we’ve got some ideas and we’ve got some justification to explore them and some mandates to start paying better attention to logs. It’s time to start playing.
Planning Stages ● Approximate events per day ● Identify inter-site bandwidth requirements ● Use cases for visualizations/searches ○ Sudo commands, per user, per host ○ disk drive read/write failures ○ VPN login attempts (failed and successful) ● Familiarization with options in market Time: 0:25 For the purposes of planning scale, you want to know how many events you want to handle, how much space that will take, etc. ● Look for places where logs won’t be evenly distributed in your network ● Find out whether some log sources will have larger messages than others in any significant way ● This can help in predicting constraints that should be explored. Come up with use cases. There should be some information that you already know you want to look for once the logs are all searchable in one place. If not, you probably don’t yet need this project on your plate. Finally, look at the options in the market people are using to solve these problems. Come up with the options.
Investigating Options ● Splunk ● ELK - Elasticsearch, Logstash, Kibana ● Graylog2 Time: 1:00 Once you get to look at the market, you get into 3 primary options out there. Splunk is the 800lb gorilla in the market. Structurally, Splunk is a collection of data nodes and agents running on machines that tail log files or watch for traffic on listening ports or something along those lines. It’s all configured in the web interface. The data can be distributed amongst all the data nodes. ELK is the Elasticsearch, Logstash, Kibana combination that the Elasticsearch company offers as their solution. Logstash is the ingestion and parsing piece of the puzzle with listening ports or pulling in data from other sources or tailing log files, etc. It will process the events, parse out any fields for specific indexing or searching statistics, filter and modify events as desired, and deliver parsed events downstream. Elasticsearch is a cluster that fulfills the search engine/indexing piece. It ingests JSON documents, allows keyword searching, field indexing, statistics aggregation, etc. Kibana is a web application entirely in HTML and CSS and Javascript that requests information from the Elasticsearch HTTP REST API and displays it in interesting ways to the end user. Graylog2 is a master/slave cluster that acts as an application server frontend for Elasticsearch. That daemon is responsible for configuring listening ports for incoming data, ingesting data on those ports into an Elasticsearch cluster, and providing access to the data via a web interface within that application server.
Prototype Design ● Very distributed, disconnected network ● Syslog log collector/relay in each location ● Anycast target address ● Systems can be under-resourced to see where/how it breaks ● Relays fan out messages to all 3 systems Time: 0:20 For our prototype design, we came up with something like this. Our network is very distributed and disconnected, so we setup a collector to relay logs in each site. It’s available at an anycasted address so every machine in the network can send to the same name/IP. Systems can be under-resourced so you can find your pain points in the prototype stages. Eventually, we wanted messages to fan out to all 3 systems to get familiar with them all
Anycast Log Relays/Collectors ● Run Logstash, listening for syslog traffic ● Run RabbitMQ for queueing ● Use RabbitMQ shovels to route logs ● Use Logstash to ingest from RabbitMQ and fork logs to all three concurrent systems Time: 1:00 So on our prototype relays, we have Logstash running and listening on port 514 sockets for syslog traffic. It parses those logs into JSON and send them to a local instance of RabbitMQ. Once the messages are in a queue, we’re using RabbitMQ’s shovel plugin to move those logs to queues on other relay machines. The shovel is a dedicated AMQP client thread that will run inside the RabbitMQ process’s Erlang virtual machine. That client is designed to do simple things like read from one queue and publish to another. In our infrastructure, we built the big central parts of these systems in AWS, and most of our edge sites cannot actually route to it. They can all route to our core datacenters, and those core datacenters can get to our AWS instances. Our edge sites’ RabbitMQ daemons have shovels that pull messages off the queue and deliver them to the RabbitMQ systems in our core sites. Those RabbitMQ systems have shovels that pull messages off the queue and deliver them to the centralized logging systems in AWS. For the purposes of the prototype, Logstash re-ingests the messages from RabbitMQ and forks out a copy of each to Splunk, Graylog2, and Elasticsearch for ELK. It’s very easy to setup multiple outputs for Logstash.
Recommend
More recommend
Explore More Topics
Stay informed with curated content and fresh updates.
![(142733/102960-Log[4])+(614851/73920-2 Log[64]) h 2 +(2329/1680-Log[4]) h 4 -h 10 /20160](https://c.sambuz.com/761724/142733-102960-log-4-614851-73920-2-log-64-h-2-2329-1680-s.webp)


