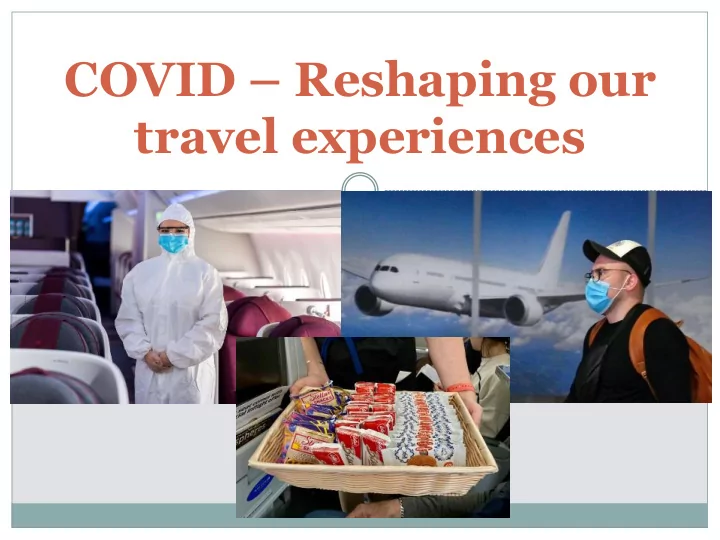

COVID – Reshaping our travel experiences
4.5 Billion Air Journeys a Year 2
Before and After COVID 3 March 2020 April 2020
Flying while sick 4 Will traveling make you sick? Is it in the aircraft, the airport, or you? What can you do to stay healthy?
Aircraft 5 HEPA filters – Protective Factor Entire volume exchanged every 2 -3 minutes 99.9% efficiency in removal of most biological contaminants Air circulating within rows not across aircraft Sit in empty rows Household members in same row No inflight COVID transmissions currently reported
Airport 6 Social Distancing is Very Important! Passengers may be infected before or after a flight Transportation to/from the airport (Taxi, Subway, Bus, Train) Airport check-in lines Waiting areas/concessions Restroom Aircraft jet way
You, Personal Responsibility 7 Wash hands – A LOT! TSA now allows 12oz of hand sanitizer in carry-on + wet wipes Good coughing habits Wear masks Limits face touching Limits droplet dispersion
NEW NORMAL 8 *GOOD HAND HYGIENE* DO NOT TRAVEL WHILE ILL SOCIAL DISTANCING WEAR A MASK
Disclaimers 9 This research was sponsored in part by a grant from the Transportation Research Board, Federal Aviation Administration The opinions, interpretations, conclusions, and recommendations are those of the author and are not necessarily endorsed by the Department of Defense, the Federal Aviation Administration, or George Mason University.
Back-up Slides 10
11
Case Study: 2003 SARS (Severe Acute Respiratory Syndrome) 12 Guangdong, China Nov 2002; index cases Mar 2003; first alerts 120 days Totals 10,000+ cases 800+ deaths 37 countries
Case Study: 2003 SARS (Severe Acute Respiratory Syndrome) 13 Public Health Response and Interventions No Travel Restrictions by WHO Saudi Arabia banned travel from China, Hong Kong, Taiwan, Singapore, Vietnam, or Canada Reduction in East Asia travel by 41% Entry and Exit Procedures Health Alert Notices and Temperature Screenings Canada, China, Hong Kong: 35 million screened Zero cases of SARS identified Quarantine Flexible and voluntary Canada: Possibly averted 13,000 infections Communication Press conferences, public health measures, educational materials China: reduction in time from symptoms to hospitalization Singapore: no further transmissions from imported cases
Case Study: 2009 H1N1 (Influenza A) 14 Mexico & US Apr 2009; first reports June 2010; pandemic declared 50 days Total: 200 million cases US: 61 million, 12K deaths
Case Study: 2009 H1N1 (Influenza A) 15 Public Health Response and Interventions No Travel Restrictions by WHO Recommendations against non-essential travel to Mexico Reduction in Mexico travel by 6% Entry and Exit Procedures Health Questionnaires and Temperature Screenings Singapore: Detected approximately 12% of cases Quarantine Social distancing and voluntary quarantines Mexico: Closure of schools; discouraged public gatherings Communication Press conferences, public health measures, educational materials CDC website: over 219 million views
Case Study: 2014 Ebola (Ebola Hemorrhagic Fever) 16 Guinea Dec 2013; initial cases Apr 2014; migrated End of 2015 27,000+ cases 11,000+ deaths
Case Study: 2014 Ebola (Ebola Hemorrhagic Fever) 17 Public Health Response and Interventions No Travel Restrictions by WHO Countries banned travel from Sierra Leone, Liberia, and Guinea Reduction in West Africa travel by 67% Entry and Exit Procedures Questionnaire and temperature screenings in Sept 2014 No cases identified Quarantine Quarantine for health care and military workers No cases averted Communication Challenges in West Africa due to cultural barriers Radio in West Africa; CDC website: over 59 million hits
Role of the Aircraft – Incubator SARS, H1N1, Ebola 18 H1N1 Many documented and undocumented cases of in-flight transmission Mexico to New Zealand: 4 in “Close Contact” China Tour Group: Index case infected those who talked to her and one “Close Contact” passenger 200 million people world-wide US: Suffered 61 million cases and over 12,000 deaths Ebola No in-flight transmission cases
Role of the Aircraft – Vector Other Cases 19 30 Years of Influenza Data “Only need to take air transportation into account” Domestic air travel volume predicts rate of influenza spread International air travel affects timing of influenza mortality Peak of influenza later in year when international travel is down especially in September Example: 9/11 World Trade Center attacks 10% drop in air travel = Delay in influenza season by 2 weeks
Travel Policies - Efficacy 20 Travel Restrictions If 99% of all travel could be stopped, epidemics in most cities would be delayed by no more than 4 months No Travel Restrictions in SARS, H1N1, Ebola Travel alerts to many of the affected cities Entry and Exit Procedures Unlikely to detect more than 10% of passengers Best temperature screenings miss up to 20% of fever No cases found in SARS/Ebola: millions screened Many found in H1N1 / Questionnaires found that individuals still chose to travel Deterrent value
Travel Policies - Efficacy 21 Quarantine Hard to justify, difficult to implement, significant costs Evident suggests that quarantining has not substantially delayed virus introduction Failed attempts in tuberculosis and Ebola cases Communication Essential in any travel policy – Foundation of implementations Social media becoming the norm in modern era Communication policies will improve compliance and reduce panic
Recommend
More recommend