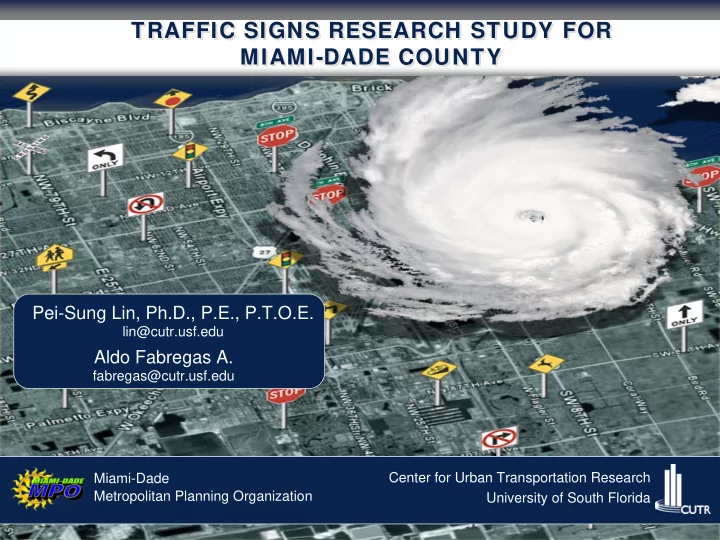

TRAFFIC SIGNS RESEARCH STUDY FOR TRAFFIC SIGNS RESEARCH STUDY FOR MIAMI-DADE COUNTY MIAMI-DADE COUNTY Pei-Sung Lin, Ph.D., P.E., P.T.O.E. lin@cutr.usf.edu Aldo Fabregas A. fabregas@cutr.usf.edu Center for Urban Transportation Research Miami-Dade Metropolitan Planning Organization University of South Florida
Hurricane Activity 2004-2005 NOAA ACE Index 10 4 kt 2 2007 Normal Above Normal Below Normal Above Normal Center for Urban Transportation Research University of South Florida
2004-2005 Hurricane Season Center for Urban Transportation Research University of South Florida
Background A considerable proportion of traffic signs failed in the 2004-2005 season Center for Urban Transportation Research University of South Florida
Problem Description Wind Speed Cat1 Cat2 Cat3 Cat4 Cat5 Sustained 74-95 96-110 111-130 131-155 >155 Speed 3-Sec 90-119 120-139 140-164 165-194 >194 Gust Strong Medium >15 o Loose Sand Soil Type Clay Strong Medium Installation Depth Weak Utilities Center for Urban Transportation Research University of South Florida
Design Standards AASHTO Standard Specifications for Structural Supports for Highway Signs, Luminaries and Traffic Signals 2001 includes provisions for hurricane winds Miami-Dade County Center for Urban Transportation Research University of South Florida
Proposed Alternatives Increase Installation Depth Cat 4-5 Cat 3 Cat 2 Cat 1 Center for Urban Transportation Research University of South Florida
Proposed Alternatives Soil Plates Cat 4-5 Cat 3 Cat 2 Cat 1 Center for Urban Transportation Research University of South Florida
Proposed Alternatives Concrete Foundation Cat 4-5 Cat 3 Cat 2 Cat 1 Center for Urban Transportation Research University of South Florida
Proposed Alternatives Drive Anchors Cat 4-5 Cat 3 Cat 2 Cat 1 Center for Urban Transportation Research University of South Florida
Conclusions and Recommendations Revise the local standards against the 2001 AASTHO standards and take the appropriate actions Design traffic signs capable of withstanding at least Category 1 hurricane wind which accounts for 90% of the scenarios for Miami- Dade County For the installation depth of 2 ft., the top two alternatives are concrete foundation and drive anchors The main advantage of drive anchors is that the installation time is significantly shorter than that required for concrete foundations If the installation depth is greater than 2 ft., then the selected two alternatives can perform better Center for Urban Transportation Research University of South Florida
Recommendations for Improvements Perform physical testing of the proposed alternatives. In the case of the drive anchors, testing 2, 3 or 4 anchor blades may be helpful Promote the regulations in the Utility Accommodation Manual which states that utilities should not be placed within 3 ft. of the right-of-way The purchase or rental of ground penetrating radars could be considered as an alternative to safely bypass the process of requesting horizontal clearance (verify with SSOCOF ) The implementation of a GIS-based signage inventory will allow to relate sign failures with soil and wind data Center for Urban Transportation Research University of South Florida
Pei-Sung Lin, Ph.D., P.E., P.T.O.E . lin@cutr.usf.edu (813)974-4910, fax (813) 974-5168 Aldo Fabregas A. fabregas@cutr.usf.edu (813)974-9819 Center for Urban Transportation Research University of South Florida
Appendix Soil Map Charts for Installation Depth Charts for Soil Plates Charts for Concrete Drive Anchor Picture Cost Effectiveness Table AASHTO Formulations Hurricane Probabilities Proposed Testing Procedure Wall of wind Center for Urban Transportation Research University of South Florida
Miami-Dade Soil Survey Center for Urban Transportation Research University of South Florida
Charts Increase installation depth in sand Increase installation depth in clay Center for Urban Transportation Research University of South Florida
Charts Soil plates in sand Soil plates in clay Center for Urban Transportation Research University of South Florida
Charts Concrete in sand Concrete in clay Center for Urban Transportation Research University of South Florida
Cost Effectiveness Cost Effectiveness Cost Effectiveness for signs in sand for signs in clay Center for Urban Transportation Research University of South Florida
AASHTO Parameters Center for Urban Transportation Research University of South Florida
Hurricane Probabilities The probabilities for a hurricane to be category 1, 2, 3 or 4 are 37, 21, 26 and 16 percent, respectively, based on the information presented in Figure 9. Therefore, for the most likely scenario for Miami-Dade the probabilities of occurrence of hurricanes category 1, 2 3, and 4 or more are 5.6 (once every 10 years), 3.2 (once every 30 years), 4 (once every 25 years), and 2.4 percent (once every 40 years), respectively Center for Urban Transportation Research University of South Florida
Drive Anchor Picture Center for Urban Transportation Research University of South Florida
Proposed Testing Procedure Center for Urban Transportation Research University of South Florida
Proposed Testing Procedure Center for Urban Transportation Research University of South Florida
Wall of Wind Center for Urban Transportation Research University of South Florida
Recommend
More recommend