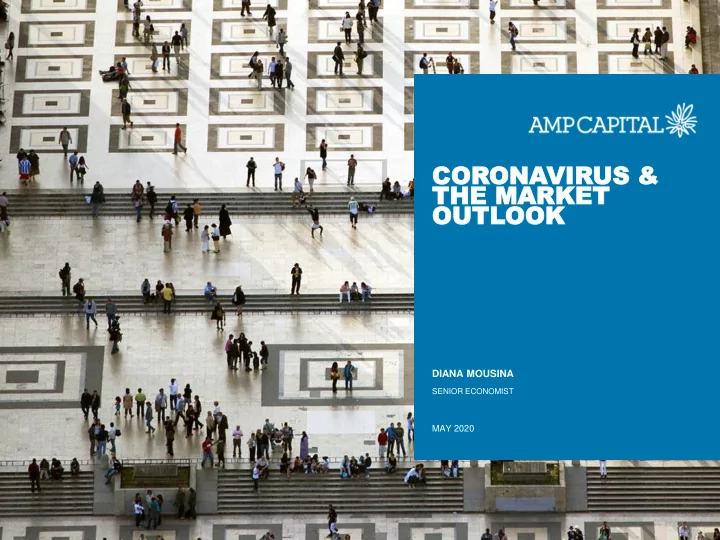
CO CORON ONAVIR IRUS US & & THE THE MARK MARKET ET OU OUTL TLOO OOK DIANA MOUSINA SENIOR ECONOMIST MAY 2020
SHARES HARD HIT BY CORONAVIRUS UNCERTAINTY – AVERAGE FALL TOP TO BOTTOM HAS BEEN ~35% 250 Index Australia - ASX 200 200 150 100 50 US - S&P 500 US - S&P 500 0 00 02 04 06 08 10 12 14 16 18 20 Source: Bloomberg, AMP Capital | 2
ECONOMIC AND INVESTMENT OUTLOOK > Expect a very large hit to global GDP in the June quarter from coronavirus driven shutdowns & uncertainty, followed by some recovery by year end as shutdowns ease > Inflation to remain low > Global monetary and fiscal stimulus is far larger than seen in the GFC > Australian fiscal stimulus is around 11% of GDP, RBA is undertaking quantitative easing (printing money). Cash rate to be around 0.25% for at least three years Shares at risk of a pull back in the short term – as we are likely to see bad data and profits - > but should provide good returns on a 12-24 month view What to watch: risk of a “second wave”, timely economic indicators, unemployment, indicators > of stress, policy stimulus, US/China tensions Key is that collateral damage from the coronavirus economic “disruption” is kept to a minimum > in terms of business failures and incomes Source: AMP Capital | 3
CORONAVIRUS CURVE FLATTENING | 4 Source: Worldometer, Bloomberg, AMP Capital
AUSTRALIA HAS BEEN DOING VERY WELL IN GETTING CORONAVIRUS UNDER CONTROL Overall Rank*** Country* Recovery Rate Active cases** Active cases/Population (mil.) Days since 1st recorded case (Total cases/Pop. mil) / Days Tests/Population (mil.) 1 New Zealand 96% 45 9 80 4 47,892 2 Australia 91% 563 23 115 2 41,621 3 S. Korea 90% 898 17 118 2 14,693 4 Iceland 99% 6 17 79 65 166,801 5 Lithuania 65% 488 175 80 7 83,891 6 Latvia 66% 327 170 76 7 46,812 7 Austria 90% 1,050 119 83 22 40,278 8 Denmark 84% 1,153 199 81 23 78,693 9 Germany 87% 15,202 183 112 19 37,584 10 Slovakia 78% 303 56 72 4 26,095 11 Israel 78% 3,403 383 87 21 57,731 12 Mexico 68% 10,713 85 79 5 1,271 13 Luxembourg 94% 136 224 77 84 99,493 14 Greece 48% 1,297 121 82 3 12,324 15 Czechia 64% 2,715 256 77 10 32,988 16 Japan 68% 4,388 35 118 1 1,932 17 Finland 79% 1,049 190 110 10 26,500 18 Switzerland 90% 1,206 142 83 43 39,709 19 Ireland 81% 3,099 639 78 64 52,486 20 Colombia 24% 11,249 227 72 4 3,741 21 Poland 40% 10,153 267 74 7 16,386 22 Hungary 40% 1,662 170 74 5 13,985 23 Canada 50% 32,670 882 113 18 34,500 24 Estonia 53% 773 585 81 17 52,411 25 Slovenia 19% 1,089 527 74 10 33,365 26 Spain 71% 54,124 1,158 108 55 64,977 27 Turkey 74% 35,333 429 68 27 19,293 28 Chile 44% 24,118 1,288 75 31 19,035 29 Italy 55.5% 68,351 1,131 109 34 49,692 30 Norway 0% 7,985 1,503 82 19 39,946 31 UK 48% 91,476 1,376 108 34 38,040 32 France 34% 90,248 1,347 115 23 21,218 33 Belgium 26% 31,598 2,766 104 47 58,961 34 Portugal 16% 23,182 2,255 76 37 60,594 35 Netherlands 48% 17,092 992 80 32 16,809 36 Sweden 16% 21,493 2,111 108 27 17,589 37 USA 23% 1,090,297 3,333 119 39 35,903 | 5 Source: Worldometer, Bloomberg, AMP Capital
GLOBAL BUSINESS CONDITIONS HAVE BEEN HARD HIT BY CORONAVIRUS, WORST GDP SLUMP SINCE 1930S Global Composite PMI vs World GDP Global Manufacturing & Services PMIs 60 6% 60 Stronger conditions Global Composite Services 5% PMI (LHS) 55 4% 50 3% 50 Manufacturing 2% 45 1% 40 0% 40 World GDP growth, annual % change (RHS) -1% 35 -2% Weaker conditions 30 30 -3% 05 06 07 08 09 10 11 12 13 14 15 16 17 18 19 20 05 06 07 08 09 10 11 12 13 14 15 16 17 18 19 20 Source: Bloomberg, AMP Capital | 6
…BUT THE CRISIS WILL HAVE SOME LASTING IMPLICATIONS > Lower for even longer interest rates > Investor caution reinforced again/consumers to remain focussed on paying down debt > Further boost to on-line retail and working from home > Further blow to globalisation/boost in support for populism/boost to US-China cold war > Further boost to big government/bigger public debt > Bad for airlines (but then so was terrorism) > Higher inequality Compliance issues – corporations being forced to hold more cash for a “rainy day”? > Some risks > Key stress points are US corporate debt, Eurozone integrity, Australian household debt > Social dislocation/tensions Big risk for President Trump (as presidents aren’t re - elected when there’s a recession), risk of “wag > the dog” (conflict with Iran, China, Venezuela to distract voters) > Money printing + bigger gov/debt + protectionism drive much higher inflation longer term | 7 Source: AMP Capital
IMPORTANT NOTE While every care has been taken in the preparation of this document, AMP Capital Investors Limited (ABN 59 001 777 591, AFSL 232497) and AMP Capital Funds Management Limited (ABN 15 159 557 721, AFSL 426455) makes no representations or warranties as to the accuracy or completeness of any statement in it including, without limitation, any forecasts. Past performance is not a reliable indicator of future performance. This document has been prepared for the purpose of providing general information, without taking account of any particular investor’s objectives, financial situation or needs. An investor should, before making any investment decisions, consider the appropriateness of the information in this document, and seek professional advice, having regard to the investor’s objectives, financial situation and needs. This document is solely for the use of the party to whom it is provided. | 8
Recommend
More recommend
Unleash a World of Digital Possibilities—Browse, Share, and Explore Content Without Boundaries