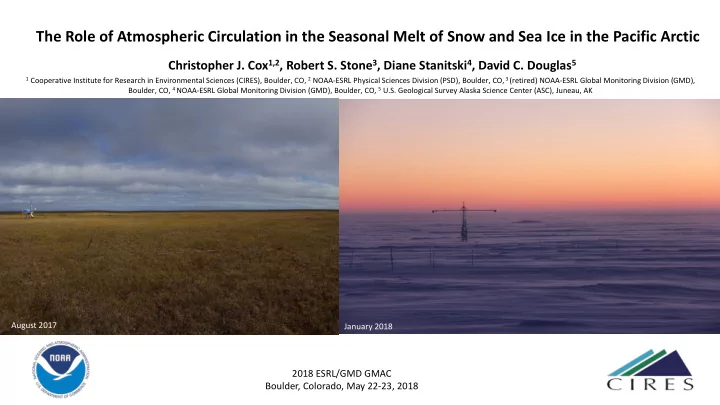

The Role of Atmospheric Circulation in the Seasonal Melt of Snow and Sea Ice in the Pacific Arctic Christopher J. Cox 1,2 , Robert S. Stone 3 , Diane Stanitski 4 , David C. Douglas 5 1 Cooperative Institute for Research in Environmental Sciences (CIRES), Boulder, CO, 2 NOAA-ESRL Physical Sciences Division (PSD), Boulder, CO, 3 (retired) NOAA-ESRL Global Monitoring Division (GMD), Boulder, CO, 4 NOAA-ESRL Global Monitoring Division (GMD), Boulder, CO, 5 U.S. Geological Survey Alaska Science Center (ASC), Juneau, AK August 2017 January 2018 2018 ESRL/GMD GMAC Boulder, Colorado, May 22-23, 2018
Date of snowmelt at Barrow, 1901-2016 2015 2015: 4 th earliest on record 2016: 1 st earliest on record 2016 Cox et al. (2017, BAMS)
Date of snowmelt at Barrow, 1901-2016 2017 2015: 4 th earliest on record 2016: 1 st earliest on record 2017: latest since 1988 2015 2016 Cox et al. (2017, BAMS)
Impact on the surface radiation budget ~969 MJ avg for positive ~294 MJ more in net-rad period 2016 than 2017
Why does this matter? Vegetation Phenology •
Why does this matter? Vegetation Phenology • Biogeochemical Cycles •
Why does this matter? Vegetation Phenology • Biogeochemical Cycles • Soil Temperature and Active • Layer Depth
Why does this matter? Vegetation Phenology • [days] Biogeochemical Cycles • Soil Temperature and Active • Layer Depth Ecology •
May Average
Years >= 5 Days late Years <= 5 Days early
N N E E W W S S
Aleutian Low Beaufort Sea Anticyclone N N E E ALBSA = [E-W] – [N-S] W W S S
Mapping May-average ALBSA to a Self Organizing Map These are the main These are the some early melt patterns late melt patterns Thanks to Michael Gallagher and Matt Shupe for the SOM
May 2002
Spatial Distribution of Anomalies Correlation [r] Correlation maps ( r ) between ALBSA in May 1979-2017 and a combination of satellite observations; the date of snow melt derived from the Northern Hemisphere Snow Cover Extent (NH-SCE) data set (terrestrial regions) and the first date of initiation of surface melt over sea ice derived from SSM/I passive microwave data (sea ice regions).
Melt Date ALBSA Mean over 30 days prior to melt
Date of snowmelt at Barrow, 1901-2016 2015: 4 th earliest on record 2016: 1 st earliest on record 2017 2017: latest since 1988 2018 2018: Experimental projection does not indicate circulation patterns 2015 associated with early melt. Regressive model suggests “average” melt date overall, but late compared to many recent years. 2016 Cox et al. (2017, BAMS)
Long Term ALBSA Record – 20 th C. Reanalysis Dots are years when |ALBSA| > 0 (p<0.01) Utqiaġvik Snowmelt Record 20 th Century Reanalysis Time Lengths of Relevant Data Sets BRW Met Observations BRW Radiation Thanks to Gil Compo for help with 20CR
Conclusions Long term records of the date of snowmelt at Utqiaġvik supported by NOAA-NWS/NOAA-GMD reveal a modern • trend towards earlier arrival of spring with extraordinary interannual variability in recent years. The environment is sensitive to this variability. • The timing of snowmelt on Alaska’s north coast and melt onset over sea ice in the Beaufort and Chukchi Seas are • linked to advection facilitated by the juxtaposition of the Aleutian Low and the Beaufort High. We developed a 4-pt climate index, “ALBSA”, that represents the variability in Pacific-Arctic atmospheric circulation. • We are currently working to assess subseasonal-to-seasonal scale (S2S) predictability of ALBSA. •
Recommend
More recommend