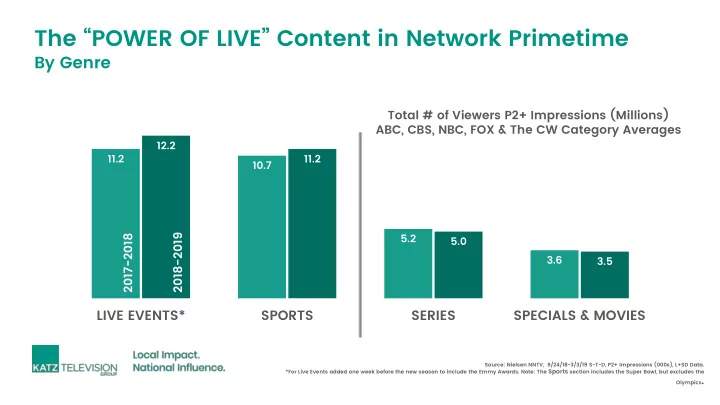

The “POWER OF LIVE” Content in Network Primetime By Genre Total # of Viewers P2+ Impressions (Millions) ABC, CBS, NBC, FOX & The CW Category Averages 12.2 11.2 11.2 10.7 5.2 2018-2019 2017-2018 5.0 3.6 3.5 LIVE EVENTS* SPORTS SERIES SPECIALS & MOVIES Source: Nielsen NNTV, 9/24/18-3/3/19 S-T-D, P2+ Impressions (000s), L+SD Data. *For Live Events added one week before the new season to include the Emmy Awards. Note: The Sports section includes the Super Bowl, but excludes the Olympics .
The “POWER OF LIVE” Content in Network Primetime By Program TOTAL # OF VIEWERS P2+ (Millions) #1 SUPER BOWL LllI-CBS 98.5 98.5 #2 AFC CHAMPIONSHIP-CBS 54.2 54.2 #3 NFC PLAYOFF-FOX 33.5 33.5 #4 THE OSCARS-ABC 29.6 29.6 #5 NFC WILDCARD-FOX 29.5 29.5 #6 NFL THU SPCL-NBC 21.7 21.7 Top 5 Sports #7 THE GRAMMYS-CBS 20.0 20.0 #9 Top 5 Specials GOLDEN GLOBES-NBC 18.6 18.6 #12 LIVE-RED CARPET 3-ABC 14.2 14.2 Top 5 Series #17 BIG BANG THEORY-CBS 13.0 13.0 #18 NCIS-CBS 12.2 12.2 #20 PRIME NYRE '19, PT 2-ABC 11.5 11.5 #21 YOUNG SHELDON-CBS 11.2 11.2 #22 60 MINUTES-CBS 10.7 10.7 #24 AGT CHAMPIONS-NBC 10.1 10.1 Note: Ranked Among ALL Programs for the Season Source: Nielsen NNTV, 2018-19 S-T-D (9/24/18-3/3/19), P2+ Impressions (000s), L+SD Data. Ranking based on all programs that ran in the 2018-19 season-to-date.
The “POWER OF LIVE” Content in Network Primetime By Genre 1.50 Viewers Per Viewing Household 1.46 1.34 1.32 LIVE SPECIALS SPORTS EVENTS SERIES & MOVIES Source: Nielsen NNTV, 2018-19 S-T-D (9/24/18-3/3/19), P2+ VPVH (Viewers per Viewing HH), L+SD Data. Ranking based on all programs that ran in the 2018-19 season-to-date.
The “POWER OF LIVE” Content in Network Primetime By Program Viewers Per Viewing Household #1 SUPER BOWL LllI-CBS 2.00 #2 PRIMETIME NYRE '19, PT 2-ABC 1.87 #3 NFL TH SPCL-NBC 1.79 PRIMETIME NYRE '19, PT 1-ABC 1.72 #4 #5 NBA CHRISTMAS SPCL-ABC 1.64 AFC CHAMPIONSHIP-CBS 1.64 #6 #7 MASTERCHEF JR: CELEB SHOWDOWN-… 1.62 Top 5 Sports #8 HOW GRINCH STOLE CHRISTMAS (R)-… 1.59 Top 5 Specials #9 CHARLIE BROWN THANKSGIVING (R)-… 1.58 Top 5 Series #10 NFC PLAYOFF-FOX 1.56 #16 TITAN GAMES (R)-NBC 1.52 #23 ELLEN'S GAME OF GAMES-NBC 1.50 #28T AFHV-ABC 1.48 #32 THE WORLD'S BEST-CBS 1.48 #35 THE MASKED SINGER-FOX 1.48 Note: Ranked Among ALL Programs for the Season Source: Nielsen NNTV, 2018-19 S-T-D (9/24/18-3/3/19), P2+ VPVH (Viewers per Viewing HH), L+SD Data. Ranking based on all programs that ran in the 2018-19 season-to-date.
The “POWER OF LIVE” & AD EFFECTIVENESS LIVE CO-VIEWING AMPLIFIES YOUR MESSAGE Direct Actions from OOH Co-viewing Talked about the brand/product with family or friends Researched online for more info Nielsen has studied live co-viewing and found that consumers § Purchased in store or online DO pay attention to specific brands and products they see Share on social media during these events. 55% 36% In fact more than 75% of adults said they were somewhat to- § A18+ 29% very likely to notice the brand or product advertised. 12% 60% Over half (55%) talked about the brand or product with family § 41% A18-24 33% or friends, over one-third researched it online, 29% made a 9% purchase and 12% shared it on social media. 60% 48% A25-34 This ad effectiveness holds true for Millennials as well with 60% 28% § 17% talking about the brand/product with family or friends and close to half going online for more info. 51% 28% A35+ 29% 9% Source: Nielsen , GENERAL POPULATION OUT-OF-HOME FALL SPORTS LOCATION SURVEY, OCT 29-31, 2018,
The “POWER OF LIVE” & AD EFFECTIVENESS § People who like to watch with family, Advertising on TV provides me with useful friends and others are more receptive information about new products and services to advertising. § Eight in 10 report that ‘advertising on TV I like watching TV together with my provides me with useful information 84% friends, family and others about new products and services’ while 60% of those who don’t prefer watching with others report find the advertising as informative. Watching with friends, family, others 60% not Important to me Source : MRI, Fall 2018.
Recommend
More recommend