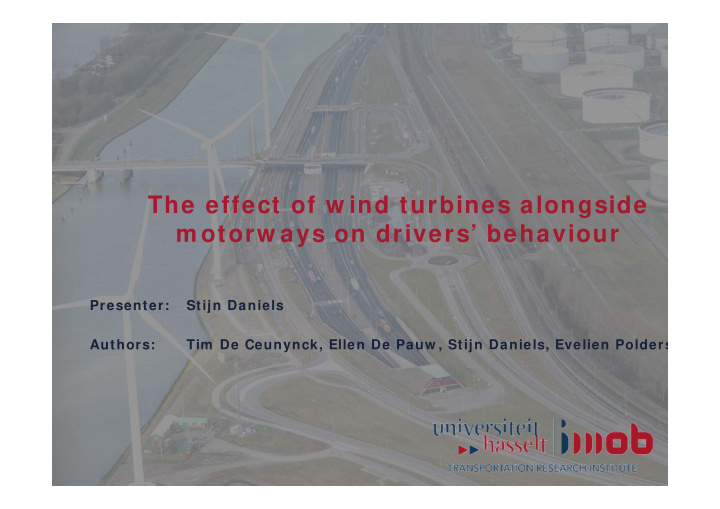


The effect of w ind turbines alongside m otorw ays on drivers’ behaviour Presenter: Stijn Daniels Authors: Tim De Ceunynck, Ellen De Pauw , Stijn Daniels, Evelien Polders
Wind turbines? • Increasing use as renewable energy source • Possible visual and acoustic impact • Location close to motorways? • Favourable wind conditions • Less environmental impact • But what about effects on • Distraction? • Behaviour? • Road Safety?
Research question “Is driving behaviour on motorways observably affected due to the presence of wind turbines in close proximity? “
Methodology One study site Before-and-after study design 3 types of analysis: Analysis of driving speed (loop detector data) Observed lateral lane position (video) Traffic conflict observation (video)
Methodology – study site Motorway section of N15 near Rotterdam, The Netherlands
Methodology – analysis of speed Inductive loop data 2 months before, 2 months after (2 conditions) Treatment sites: 5 consecutive loop detectors near the first wind turbines 2 comparison sites Only daytime data are used (6h00 – 21h59) Effect on mean speed and SDDS analysed Model form: � � � � � � � � � � � � � � � � � � � � � � ɛ
Methodology – analysis of lateral position Temporary cameras on 3 consecutive lamp posts Each covering about 200 m Close to the first wind turbine 3 conditions: No wind turbines (=before) Wind turbines parallel to roadway Wind turbines perpendicular to roadway
Methodology – analysis of lateral position B&A: 2x24h analysed (matched hours) Absolute lane position & SDLP analysed Lateral position of every 10th vehicle 3,649 vehicles in total 3 measurement points (at entry of each camera view) Also registered: Driving lane Vehicle type Day/night 2 regression models built
Methodology – analysis of traffic conflicts Situations considered as serious conflicts if: Serious according to STCT TTC min ≤ 1.5s
Methodology – video analyses Lateral positions & conflict severity measured using T-Analyst
Results – driving speed (mean) Overall effect ‐ 2.24 km/h [ ‐ 2.25; ‐ 2.24] 1 Location Mean speed Mean speed Evolution before ‐ after before (km/h) after (km/h) (km/h) [95%CI] Study site 1 99.75 99.31 ‐ 0.44 [ ‐ 0.44; ‐ 0.44] Study site 2 99.70 98.65 ‐ 1.05 [ ‐ 1.06; ‐ 1.05] Study site 3 99.58 98.78 ‐ 0.79 [ ‐ 0.80; ‐ 0.79] Study site 4 100.11 98.36 ‐ 1.75 [ ‐ 1.75; ‐ 1.74] Study site 5 98.99 97.39 ‐ 1.60 [ ‐ 1.61; ‐ 1.60] Comparison site 1 95.36 96.59 +1.23 [+1.23; +1.24] (upstream) Comparison site 2 107.85 110.51 +2.29 [+2.28; +2.29] (downstream)
Results – driving speed (SDDS) Location SDDS before (km/h) SDDS after Evolution of SDDS (km/h) (km/h) Study site 1 9.24 10.57 +1.33 Study site 2 9.70 10.67 +0.97 Study site 3 9.45 10.33 +0.88 Study site 4 9.67 10.29 +0.62 Study site 5 9.86 10.07 +0.21 Comparison site 1 7.67 7.69 +0.02 (upstream) Comparison site 2 11.09 9.90 ‐ 1.19 (downstream)
Results – lateral position (absolute) Variable p ‐ value of Category Estimate (in S.E. p ‐ value of variable meter) category Constant < 0.001 0.847 0.008 < 0.001 HGV ‐ 0.165 0.008 < 0.001 Vehicle type < 0.001 Minivan ‐ 0.045 0.015 0.003 Passenger car 0 (ref.) Left ‐ 0.156 0.009 < 0.001 Lane < 0.001 Right 0 (ref.) Night ‐ 0.066 0.015 < 0.001 Time < 0.001 Day 0 (ref.) Blades parallel (after) ‐ 0.136 0.009 < 0.001 Blades perpendicular (after) ‐ 0.078 0.009 < 0.001 Condition < 0.001 No turbines (before) 0 (ref.)
Results – lateral position (SDLP) Variable p ‐ value of Category Estimate S.E. p ‐ value of variable category Constant < 0.001 0.141 0.003 <0.001 HGV ‐ 0.027 0.003 <0.001 Vehicle type < 0.001 Minivan ‐ 0.003 0.006 0.609 Passenger car 0 (ref.) Left ‐ 0.020 0.004 <0.001 Lane < 0.001 Right 0 (ref.) Night ‐ 0.015 0.006 0.011 Time 0.011 Day 0 (ref.) Blades parallel (after) 0.001 0.004 0.736 Blades perpendicular (after) 0.007 0.004 0.057 Condition 0.156 No turbines (before) 0 (ref.)
Results – traffic conflicts Few situations preselected for further analysis Mainly lane changing in front of approaching vehicle None were serious conflicts
Discussion Shift in lateral position: No effect on safety in itself Possible indication for distraction SDLP: Increase in SDLP is generally unfavourable for road safety Limited effect (ns)
Discussion SDDS Increase in SDDS tends to have a negative effect on road safety Small increases are not expected to have an effect Salusjärvi (1990)
Discussion Driving simulator study (Alferdinck et al., 2012) Increase of SDDS and SDLP when turbines are located close to the motorway Longer gaze Slightly lower average speed Present results are well in line with DS study
Conclusions Wind turbines lead to some observable behavioural adaptations: Reduction of mean speeds Shift in lateral position towards the left Small increases in SDLP and SDDS Resulting effect on safety not yet clear, although not likely to be substantial
Acknowledgement Study funded by the Ministry of Infrastructure and the Environment, The Netherlands. Content is the sole responsibility of the authors
Thank you for your attention! Questions?
Recommend
More recommend