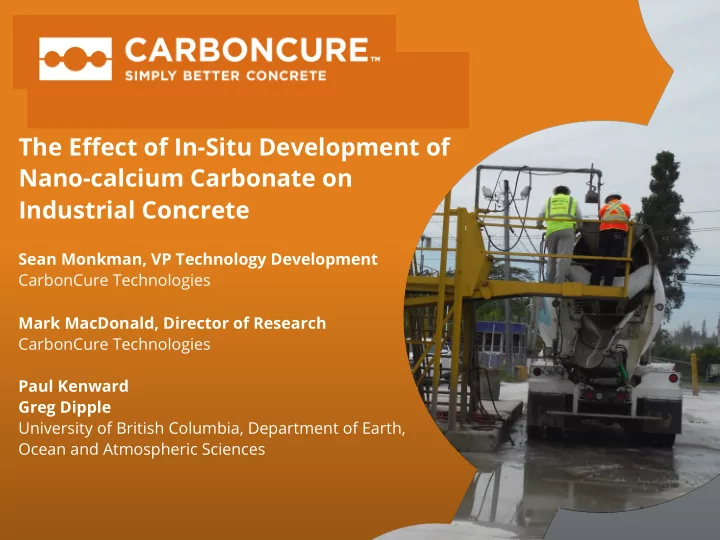

The E ff ect of In-Situ Development of Nano-calcium Carbonate on Industrial Concrete Sean Monkman, VP Technology Development CarbonCure Technologies Mark MacDonald, Director of Research CarbonCure Technologies Paul Kenward Greg Dipple University of British Columbia, Department of Earth, Ocean and Atmospheric Sciences 1 www.carboncure.com Simply Better Concrete 1
Carbonation Of Freshly Hydrating Cement Seeking beneficial reuse of CO 2 in concrete production C3S (alite) + 3H 2 O ↔ 3Ca 2+ + SiO 2 0 + 6OH - Dissolution C2S (belite) + 2H 2 O ↔ 2Ca 2+ + SiO 2 0 + 4OH - ( Ca 2+ Supply ) Ca(OH) 2 + H 2 O ↔ Ca 2+ + 2OH - + H 2 O + CO 2 (g) ↔ CO 2 (aq) CO 2 CO 2 (aq) + H 2 O ↔ H 2 CO 3 (aq) Dissociation ( CO 3 -2 Supply ) H 2 CO 3 (aq) ↔ HCO 3 - (aq) + H + = HCO 3 (aq) ↔ CO 3 -2 (aq) + H + - Ca +2 (aq) + CO 3 (aq) ↔ CaCO 3 (s) Precipitation -2 ( CO 2 Storage ) 2 www.carboncure.com Simply Better Concrete 2
Industrial Masonry Pilot • Dosed 1.5% CO 2 by weight of cement • Added CO 2 as part of normal batching and mixing • Monitored strength, density and absorption • Quanti fi ed CO 2 uptake www.carboncure.com Simply Better Concrete 3
Industrial trial CMU Compressive Strength 5000 119% 119% 4000 118% Compressive Strength (psi) 76% 3000 68% 62% 2000 1000 28 day 56 day 7 day 0 Blended 1.5% CO2 1.5% CO2 + water Control Condition www.carboncure.com Simply Better Concrete 4
Industrial trial CMU Absorption and Density 134 9.5 9.0 132 130.7 8.5 8.5 130.4 Absorption (ln/ft 3 ) 130 Density (lb/ft 3 ) 8.0 128 7.5 7.5 126 7.0 7.0 124.1 124 6.5 122 6.0 Control 1.5% CO2 1.5% CO2 + Control 1.5% CO2 1.5% CO2 + water water Condition Condition Carbonated: 5.0% lower density, 11% lower absorption • Carbonated w/ water increase: 0.2% lower density, 18% lower absorption • www.carboncure.com Simply Better Concrete 5
Industrial trial Masonry Takeaways • Carbonated batch had drier appearance and poor compaction • Increased water by 14%, product appearance was unchanged • At target density a strength bene fi t of about 18% was realized www.carboncure.com Simply Better Concrete 6
Ready mixed concrete trial • CO 2 was supplied into truck after batching. • Monitored slump, temperature, compressive strength, air content • The concrete dosed with CO 2 20-25 min after the mixing started. • Targeted constant water 7 www.carboncure.com Simply Better Concrete 7
Industrial Trial Fresh Results Temperature Mix Air Content Slump (in) CO 2 Uptake (°C) Control 5.9% 7 25.8 - 1.0% CO 2 5.9% 4 28.1 0.44% 1.5% CO 2 4.5% 3 28.6 1.69% • Workability was decreased due to CO 2 • Air content may have decreased with higher dose of CO 2 8 www.carboncure.com Simply Better Concrete 8
Industrial Trial Compressive Strength Results 40 111% 35 117% 5000 103% 107% 30 Compressive Strength (MPa) 109% Compressive strength (psi) 4000 104% 25 3000 20 15 98% 96% 2000 10 0.44% CO2 1.69% CO2 1000 5 Control 0 0 1 day 7 days 28 days 56 days Test Age 9 www.carboncure.com Simply Better Concrete 9
Ready-mix takeaways • Workability reduced • Strength neutral or improved • Resistivity una ff ected • Durability assessment ongoing 10 www.carboncure.com Simply Better Concrete 10
What did the CO 2 do? 140 Control 2.10 CO2 dose 1 120 2.08 CO2 dose 2 2.06 100 2.04 Cylinder Density (g/cm 3 ) Slump (mm) 2.02 80 98.1% ¡ 2.00 97.6% ¡ 60 1.98 1.96 95.7% ¡ 40 1.94 1.92 20 1.90 0 1.88 2000 2100 2200 2300 2400 2500 Control CO2 dose 1 CO2 dose 2 CO2 dose 3 Mix water (ml) Condition 11 www.carboncure.com Simply Better Concrete 11
Mechanism • Carbon dioxide addition leads to nano-CaCO 3 formation. • Compaction and workability e ff ects were attributable to new surface area created • Strength bene fi t associated with nucleation • Study ongoing to characterize the reaction • E ff ects observed when seeking to maximize CO2 uptake. • In ready mix, optimizing the dose to achieve property bene fi ts can avoid the workability loss. 12 www.carboncure.com Simply Better Concrete 12
www.carboncure.com Simply Better Concrete 13
Model Comparison to SCMs 100000 90000 Speci fi c Surface Area (m 2 /kg) 80000 70000 60000 50000 40000 30000 20000 10000 0 Ground Fly Ash Calcined Calcined Metakaolin Silica Fume 50 nm 25nm Slag Shale Clay CaCO3 CaCO3 In situ formed nano-CaCO 3 has far greater a speci fi c surface area than SCMS. 14 www.carboncure.com Simply Better Concrete 14
Comparison to Silica fume Component Unit Block Trial RM trial CO 2 uptake % bwc 1.40% 1.69% Amount CaCO 3 kg 10.60 12.91 Particle diameter nm 25 25 New surface area m 2 625,331 761,665 SF speci fi c surface area m 2 /kg 20,000 20,000 Amount silica fume % bwc 9.39% 11.33% Model • Surface bound rhombohedral particle • Small amounts of CO 2 = large amounts of silica fume • A particle of 25 nm is likely a conservatively large estimate 15 www.carboncure.com Simply Better Concrete 15
In situ nano-CaCO 3 formation • Simple retro fi t technology • No dispersion/sonication required • Cement sensitivity, as per admixtures • Widely available feedstock, uses waste CO 2 16 www.carboncure.com Simply Better Concrete 16
Thank You www.carboncure.com Simply Better Concrete 17
Thank You IMG_1619.JPG 18 www.carboncure.com Simply Better Concrete 18
19 www.carboncure.com Simply Better Concrete 19
Recommend
More recommend