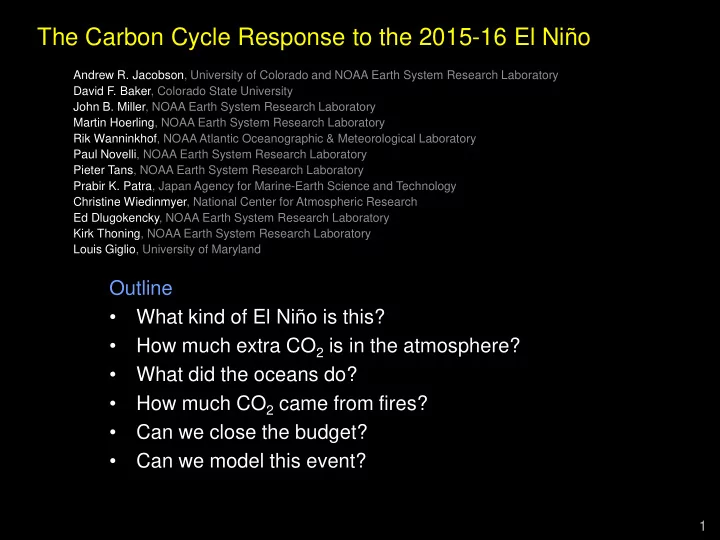

The Carbon Cycle Response to the 2015-16 El Niño Andrew R. Jacobson, University of Colorado and NOAA Earth System Research Laboratory David F. Baker, Colorado State University John B. Miller, NOAA Earth System Research Laboratory Martin Hoerling, NOAA Earth System Research Laboratory Rik Wanninkhof, NOAA Atlantic Oceanographic & Meteorological Laboratory Paul Novelli, NOAA Earth System Research Laboratory Pieter Tans, NOAA Earth System Research Laboratory Prabir K. Patra, Japan Agency for Marine-Earth Science and Technology Christine Wiedinmyer, National Center for Atmospheric Research Ed Dlugokencky, NOAA Earth System Research Laboratory Kirk Thoning, NOAA Earth System Research Laboratory Louis Giglio, University of Maryland Outline • What kind of El Niño is this? • How much extra CO 2 is in the atmosphere? • What did the oceans do? • How much CO 2 came from fires? • Can we close the budget? • Can we model this event? 1
Record CO 2 growth rate at Mauna Loa in 2015 Week ending on May 15, 2016: 407.84 ppm Weekly value from 1 year ago: 403.83 ppm 2
3
4
5
Note timing 6
Note timing 7
El Niño-driven anomalous CO 2 (PgC) 1997-98 2015-16 1.9 to 2.2 1 2.2 to 3.6 1 Atmosphere 1. This work 8
9
10
SST anomaly flux anomaly 11
El Niño-driven anomalous CO 2 (PgC) 1997-98 2015-16 1.9 to 2.2 1 2.2 to 3.6 1 Atmosphere -0.5 2 to -0.7 3 (-0.3 to) 0.4 2 Oceans 1. This work 2. NOAA AOML monthly p CO 2 3. Chavez et al. (Science, 1999) 12
Apocalyptic fire season? Not according to MODIS-driven fire models (GFAS and FINN). Perhaps smoldering peat fires? Photo credit: Martin Wooster 13
249 ppb NOAA in situ flask CO 14
Referenced to 2000-2014 MOPITT CO climatology 15
Referenced to 2000-2014 MOPITT CO climatology 16
Referenced to 2000-2014 MOPITT CO climatology 17
Referenced to 2000-2014 MOPITT CO climatology 18
Referenced to 2000-2014 MOPITT CO climatology 19
2015 fire CO 2 emissions estimated from CO (TgC) Emission ratio (ppb CO per ppm CO 2 ) 50 100 150 grasslands forest forest & peat Sep 2015 – 30 ° S to 30 ° N 45.0 22.5 15.0 Oct 2015 – 30 ° S to 30 ° N 239.9 119.9 80.0 Oct 2015 - plume 209.2 104.6 69.7 Nov 2015 – 30 ° S to 30 ° N 302.1 151.0 100.7 Sep through Nov 2015 total 587.0 293.4 195.7 assumes 1 month CO decay time Thanks to John Miller for help in this analysis 20
El Niño-driven anomalous CO 2 (PgC) 1997-98 2015-16 1.9 to 2.2 1 2.2 to 3.6 1 Atmosphere -0.5 2 to -0.7 3 (-0.3 to) 0.4 2 Oceans 0.8 to 3.7 4 0.1 to 0.3 1 Fire 0.8 to 2.6 5 1. This work 2. NOAA AOML monthly p CO 2 3. Chavez et al. (Science, 1999) 4. Langenfelds et al. (GBC, 2002) 5. Page et al. (Nature, 2002) 21
NOAA CO MBL surface • Network not so sensitive to tropics • This El Niño is unlike 1997-98 22
El Niño-driven anomalous CO 2 (PgC) 1997-98 2015-16 1.9 to 2.2 1 2.2 to 3.6 1 Atmosphere -0.5 2 to -0.7 3 (-0.3 to) 0.4 2 Oceans 0.8 to 3.7 4 0.1 to 0.3 1 Fire 0.8 to 2.6 5 0.2 to 1.3 1 2.1 to 2.9 1 Residual land 1. This work 2. NOAA AOML monthly p CO 2 3. Chavez et al. (Science, 1999) 4. Langenfelds et al. (GBC, 2002) 5. Page et al. (Nature, 2002) 23
Through January 2016, CT-NRT sees an anomaly of only about 0.4 PgC. 24
25
Referenced to 2007-2014 GOME-2 SIF climatology 26
Referenced to 2007-2014 GOME-2 SIF climatology 27
Referenced to 2007-2014 GOME-2 SIF climatology 28
Referenced to 2007-2014 GOME-2 SIF climatology 29
Referenced to 2007-2014 GOME-2 SIF climatology 30
Referenced to 2007-2014 GOME-2 SIF climatology 31
Referenced to 2007-2014 GOME-2 SIF climatology 32
Conclusions • The 2015-16 El Niño is not over! • It is responsible for 2.2 to 3.6 PgC extra CO 2 in the atmosphere - so far . • The fire contribution in 2015 was small. • The ocean response may have been atypical. The residual land emission anomaly is 2.5 ± 0.4 PgC. • • CarbonTracker does not yet see this El Niño. Next steps • Confirm small fire contribution • Look at other air-sea flux products • Will models pick this up in early 2016? Stay tuned. 33
Recommend
More recommend