th the ev evalu luation ation of s f syndro romi mic c surv - PowerPoint PPT Presentation
Usin sing compart rtme mental ntal models s fo for r th the ev evalu luation ation of s f syndro romi mic c surv rveillance eillance systems tems in Englan land Felipe J Coln-Gonzlez With input from: Iain R Lake, Roger A
Usin sing compart rtme mental ntal models s fo for r th the ev evalu luation ation of s f syndro romi mic c surv rveillance eillance systems tems in Englan land Felipe J Colón-González With input from: Iain R Lake, Roger A Morbey, Alex J Elliot and Gillian E Smith Workshop on Mathematical Models of Climate Variability, Environmental Change and Infectious Diseases 15 May 2017
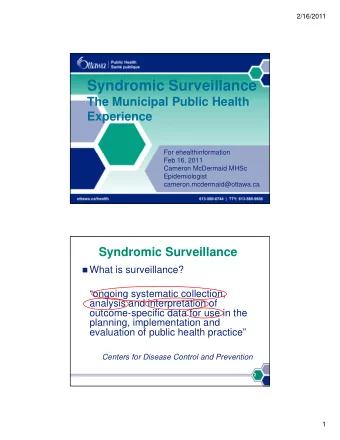
What is syndromic surveillance? Syndromic surveillance collects, analyses, and disseminates data on disease symptoms to provide early warnings about public health threats in near-real-time (Buehler et al., 2009). A key rationale of syndromic surveillance is that it may detect health threats faster than traditional surveillance systems (e.g. laboratory reports). This may permit more timely, and hence potentially more effective public health action to reduce morbidity and mortality.
Syndromic surveillance The investigation of potential outbreaks faces a great deal of uncertainties Similar symptoms/syndromes between diseases Each outbreak has a unique manifestation What will the next big event look like? Health-care seeking behaviour Reporting uncertainties Diagnosis is as good as the ability of the medical professional Population coverage of the systems
Syndromic surveillance in England In England, the Real Time Syndromic Surveillance Team (ReSST) at Public Health England (PHE) obtains and analyses data from four National Health Service (NHS) healthcare settings: A telehealth consultation system (NHS-111) in-hours General Practitioner consultations (GPIHSS) out-of-hours and unscheduled General Practitioner consultations (GPOOHSS) emergency department attendances (EDSSS)
Aberration detection The syndromic indicators (e.g. counts of fever, cough, diarrhoea, gastroenteritis) from these syndromic surveillance systems are compared on a daily basis with the expected number of consultations to identify anomalous patterns (aberrations) To do so, they use a statistical multi-level model (RAMMIE) A data value outside expected bounds is an indicator of potentially important unusual activity . Although exceedances may be random events of little concern.
Aberration detection capabilities To fully evaluate the role of syndromic surveillance within public health, it is critical to assess the types of events that can be detected , how long such systems take to detect the event, and of equal importance, those events that cannot be detected.
Knowledge gap Research evaluating the performance of syndromic surveillance systems is scarce. Most previous studies have used: a single disease type (Fan et al., 2014) one or two syndromic data sources (e.g. Bordonaro et al., 2016). No studies have investigated whether detection capabilities vary according to time of year
Knowledge gap Previous studies have seldom considered the uncertainties arising from: potential differences between outbreaks, the probability of people consulting health services monitored by a syndromic surveillance system, The proportion of people being coded to a particular syndromic indicator by a health professional.
Addressing the gap We developed an evaluation framework for the evaluation of syndromic surveillance systems that aims to account for these uncertainties and allows their investigation The framework has five main stages 1. Outbreak simulation 2. Conversion 5. Aberration to syndromic detection data 4. Impose 3. Baseline outbreak data computation to baseline
Scenarios We developed scenarios to evaluate our framework: A national outbreak of influenza similar to A(H1N1)pdm09 (swine flu) occurring in England as a consequence of international travelling A local outbreak of cryptosporidiosis in a metropolitan area as a consequence of failure in a water treatment plant
1. Outbreak simulation: Influenza
1. Outbreak simulation: Cryptosporidium
Model parameters To explore uncertainty, we simulated models using the 10 th , 50 th , and 90 th percentiles of the distribution of values for each of the following parameters: Influenza Cryptosporidium R 0 Number of exposed people Incubation period Number of oocysts released Infectious period Probability of infection Fraction of asymptomatic Incubation and infectious period Infectivity reduction on Proportion of asymptomatic asymptomatic
2. Conversion to syndromic data Each system has a different coverage Code Not all symptomatic people will consult a Consultations health-care system People may be coded Coverage to different indicators by health Symptomatic professionals
2. Conversion to syndromic data Not all symptomatic people will report on the first day of symptoms We used a health-seeking behaviour model Day 1 Day 2 Day 3 . . .
3. Baseline simulation Expected number of cases and its 99% confidence intervals for 2015 based on historical data using a mixed effects statistical model The upper bound of the CI used as alarm threshold We simulated 100 time series for each baseline Alarm threshold Baseline Historical series
4. Test data We added the downscaled outbreak data to the 100 simulated baselines Outbreak data were imposed onto the baseline every other day across the whole year Time
5. Aberration detection By chance, about 1% of the simulated baseline data will exceed the alarm threshold To reduce the impact of false alarms, we considered detection as the time the alarm threshold was exceeded for three or more days .
5. Aberration detection
Results We analysed 4,422,600 time series per indicator 243 outbreaks × 100 MC baselines × 182 initial dates
Results All outbreaks were detected by all systems TD decreases as the size of the outbreak increases Outbreaks likely to be detected at day 102, 61, and 47 when there are likely to be 9.4, 12.6 and 14.2 symptomatic individuals. GPIHSS detected the outbreaks considerably before any other system
Results Not all systems had the same coverage What if they did? GPIHSS was still one of the best systems for detection TD reduced slightly
Seasonal effects On average, outbreaks starting in Feb-July had a lower TD compare to one starting in Aug-Jan Outbreaks starting in July had TD=40 days compared to TD=47 days if started in November (GPIHSS)
Results Cryptosporidium Outbreaks of cryptosporidiosis will be more local in nature The ability to detect outbreaks of different sizes varies by indicator. Small and medium size outbreaks (i.e. ∼ 854 and ∼ 1,281 exposed people per day) are not consistently detected EDSSS was unable to detect any outbreak
Results cryptosporidiosis Even after increasing the coverage to 100% most outbreaks go unnoticed A reduction in the TD is noticed
Seasonal effects
Access to healthcare No significant effect was detected
We highlight the importance of using different system-syndrome indicators for event detection. For example, syndromic surveillance data from EDSSS in England are useful for the detection of pandemic influenza but not for the identification of local outbreaks of cryptosporidiosis. Interestingly, emergency department data are the most widely used source of syndromic surveillance data worldwide
The framework allows the exploration of the uncertainties related to the characteristics of the outbreaks as well as the features of the systems We argue that our framework constitutes a useful tool for public health emergency preparedness
Thank you! F.Colon@uea.ac.uk
Recommend


More recommend
Explore More Topics
Stay informed with curated content and fresh updates.