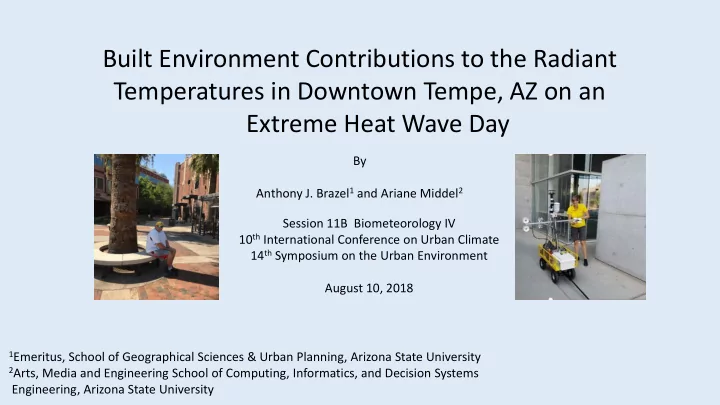

Built Environment Contributions to the Radiant Temperatures in Downtown Tempe, AZ on an Extreme Heat Wave Day By Anthony J. Brazel 1 and Ariane Middel 2 Session 11B Biometeorology IV 10 th International Conference on Urban Climate 14 th Symposium on the Urban Environment August 10, 2018 1 Emeritus, School of Geographical Sciences & Urban Planning, Arizona State University 2 Arts, Media and Engineering School of Computing, Informatics, and Decision Systems Engineering, Arizona State University
* *from Tempe.gov
Purpose ٠ Given the concern for human comfort and walkability in Tempe, we explore the variability of a major factor of human comfort – Mean Radiant Temperature or MRT. ٠ Under hot, dry, clear-sky conditions with low wind speed, outdoor thermal comfort is mainly driven by Mean Radiant Temperature. ٠ We have previously collected observations using Kestrel global thermometers and used Rayman. (ICUC9 Poster, 2015, “ Mill Avenue, Tempe, AZ Downtown Microclimate – An APA-designated Best Street ” , Jour. Urban Design , 2016 “ Desert New Urbanism: testing for comfort in downtown Tempe, Arizona ” ) ٠ Here we use more accurate six directional method of radiant fluxes and mobile sampling.
Circles in red are sites with higher SVFs and more open.
٠ CART has been used for a previous study of the ASU campus - Ariane Middel, Scott Krayenhoff, in preparation , Micrometeorological Factors Determining the Outdoor Thermal Environment During Record-Breaking Extreme Heat in Tempe, Arizona: Design for Optimal Microscale Heat Mitigation, Building and Environment .
• MRT • Six-directional method applying angular factors for a standing reference person (VDI 1998*): W i : weighting factors (0.06 up/down, 0.22 lateral) K i : directional shortwave radiation 4 σ 𝑗=1 6 𝑋 𝑗 𝑏 𝑙 𝐿 𝑗 + 𝑏 𝑚 𝑀 𝑗 L i : directional longwave radiation 𝑁𝑆𝑈 = − 273.15 𝐿 𝑏 𝑚 ∙ 𝜏 a k : shortwave absorption coefficient (0.70) a l : longwave absorption coefficient (0.97) *VDI. (1998). VDI 3787, Part II: Environmental Meteorology: Methods for the Human-biometeorological Evaluation of Climate and Air Quality for the Urban and Regional Planning at Regional Level. Part I: Climate. 7
٠ Six microclimate transects on June 21, 2017 between 0800 and 2000 LST at 0800, 1000, 1200, 1400, 1700, 2000. ٠ Air temperature, relative humidity, shortwave and longwave radiation in six directions, and 2D wind speed and direction were logged at 2-s intervals 16 transect stops of 45+ seconds to account for sensor lag. ٠ Sampled locations include a variety of heterogeneous environments, i.e. fully shaded and partially shaded sites, artificial and natural shade, sun-exposed sites, and varying ground cover (concrete, asphalt, brick, artificial turf, mulch) ٠ Observations were time-detrended to the full hour for cross-site comparison.
o C Ta, RH, WS June 21, 2017 NWS Sky Harbor Int Airport Sky Harbor NWS June, 2017 T a 50 50 48 45 46 40 44 42 35 40 30 38 36 25 34 20 32 30 15 28 10 26 24 5 22 0 20 0 2 4 6 8 10 12 14 16 18 20 22 24 0 1 2 3 4 5 6 7 8 9 10 11 12 13 14 15 16 17 18 19 20 21 22 23 24 25 26 27 28 29 30 Ta oC RH % WS m/s max min
e.g., Obstructed Sites Photos Top Left to Bottom Right correspond to SVFs Left to Right
mean 0800 to 1700 2000 MRT MRT MRT o C peak o C o C ID surface type Orientation shade type SVF time 11 asphalt parking lot buildings 0.80 est 65.5 70.9 1459 38.3 115 gravel vacant lot buildings 0.80 est 67.1 73.7 1501 36.3 117 wood mulch near vacant lot buildings/trees 0.80 est 65.3 74.7 1502 35.4 9 brick/concrete NS EW sidewalk NW corner 0.75 62.6 72.3 1447 37.0 7 cement Plaza palms/blds 0.70 est 65.5 68.4 1722 39.3 45 brick NS E sidewalk blds/trees 0.60 60.4 69.7 1710 40.9 3 cement EW street blds/trees 0.60 est 62.0 65.5 1415 39.7 8 cement NS walkway canyon/trees/blds 0.52 56.1 69.2 1443 38.9 6 Art Turf Plaza/Trees Tree/Blds 0.50 est 63.9 73.0 1436 39.0 14 concrete NS walkway Canyon/blds 0.27 49.7 69.1 1400 41.2 4 brick EW walkway canyon/Blds/trees 0.25 50.0 72.6 1421 42.1 13 brick EW N sidewalk sidewalk overhang 0.21 49.5 57.9 1257 38.3 5 brick EW walkway Canyon/blds 0.20 45.2 56.5 1433 39.6 10 brick NS W sidewalk tree canopy/blds 0.19 50.0 60.5 1244 39.3 12 brick EW N sidewalk Arcade Walk 0.05 39.5 44.3 1504 38.5 1 concrete EW walkway Tunnel 0.03 37.6 44.7 1700 41.2
SVF vs MRT o C Mean 0800-1700) 70.0 65.0 60.0 55.0 50.0 45.0 40.0 35.0 30.0 0.00 0.10 0.20 0.30 0.40 0.50 0.60 0.70 0.80 0.90
South protection, narrowing walkways, use of trees, and tunneling walkways MRT mean 0800-1700 values South-facing protected sites Narrow E-W Open Plazas and lots Narrow N-S 60 o C, peaks >70 o C 10 o C reduction 15 o C reduction 10-20 o C reduction High peaks noon “ tunnel ” through building Arbor walkway Sidewalk trees 23 o C reduction 10 o C reduction
Additional Analyses 1. Further investigate role of material variability and corresponding Ɛ and µ values as they influence T s 2. Investigate K ↓ variations from stations available in the PMA and relate to local factors. 3. Use CART information to aid in ongoing model evaluation of built environment microclimates using e.g., Rayman and ENVI met. Ongoing study - An Evaluation of Mean Radiant Temperature Estimations in an Arid Urban Climate , Peter J. Crank, Melissa Wagner, Ariane Middel, Anthony Brazel, Dani Hoots ASU, Martin Smith, Univ. Minnesota Twin Cities, Abstract submitted to AGU 2018.
Recommend
More recommend