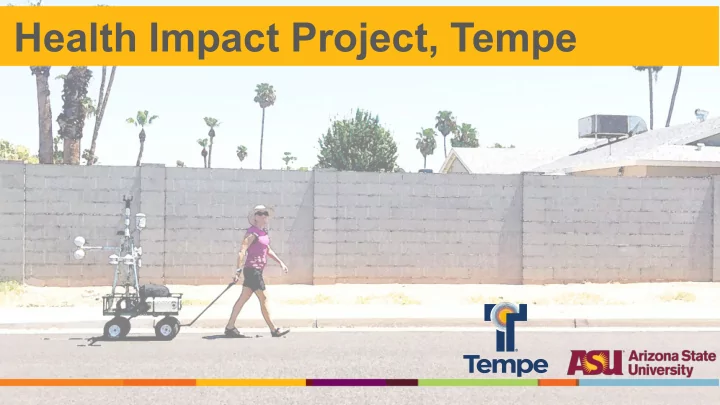

Health Impact Project, Tempe
Climate Ac e Action + + Ex Extrem eme e Hea eat
Pew H Health I Impac act P Proj oject, T Tempe What urban infrastructure is associated with thermal comfort and discomfort? Four Activities: 1. citywide survey (heat and health) Kiwanis/ The Lakes Character Area Only 2. neighborhood microclimate assessment • playground and public space assessments, 3. participatory heat assessments • (heat walk event), and integrate that data to inform a 4. climate action co-design workshop • (park design), which aims to co-produce solutions with residents.
Stra rategy 1. Survey Informal public conversation 2. Microclimate assessment Increase 3. Participatory assessment dialog on heat • Guidelines/ 4. guidelines Workshops • Standards • Codes • All hazards mitigation plans • Emergency manager
Per erfor orman ance M Measure T Targets 1) In each of the city’s character areas, less than 20% of residents report experiencing heat-related illness in the past 12 months. 2) In each of the city’s character areas, less than 15% of residents report experiencing significant negative impacts due to high temperature in their homes in the past 12 months.
Infrastruc uctur ure • Parks and Play Spaces • Multiuse Paths • Arterial Walls • Parking Lots
Microcl climate A Asse ssess ssments ts 1. Arable Weather Stations, sun/shade 2. MaRTy Transect Assessment
Field W Wor ork, k, August – October, 2019
MaRTy Ty Tran anse sect cts
Hea Heat W Walk - “Informed and hot!”
Field W Wor ork L k Loc ocations
Pa Park & & Pl Playspac paces, Kiwanis Park
Mean an Ra Radi diant T Tem emperature ( (MRT), 8 8am
12PM
12PM
Kiwanis Park, Tempe Parks & s & Pl Playspac paces August 25, 2019 during 7-8pm thermal comfort transect Key points: • Tension between accessibility and surface temperature hazards • Trees and shade structures can reduce MRT by 30-50 ∘ F at noon • Focus on creating more usable playspaces for more hours each day and longer season - shade • Data collection can be an engagement activity – • Informal questions from public • Formal Heat Walk
8AM Multi-Use P e Paths hs Kiwanis Park
“Wow, it’s 93 in the shade but 120 Mu Multi-Use Pa Paths something over there” - Heat Walker Key points: • At 8am commute time, shaded parts of North-South Western Canal path were up to 60 ∘ F cooler (MRT) than sun soaked All American Way • East-West El Paso Path MRT was 10- 40 ∘ F cooler than adjacent College Ave • Heat walks help align thermal experience, MRT, and surface temperature data and promote learning
Arterial W l Walls lls Mostly Central and Northern Tempe
Surface T e Temper eratures es
Arterial W l Walls lls #9, East Facing Wall on west side of Rural, north of Broadway Key points: • Shade, thermal capacity, and orientation impact on surface temperatures • Thermal performance varied depending on hour of day • Structural concrete columns and ground beams showed highest night time temperatures • The effect of wall surface roughness, as in smooth versus rough masonry, was not thermally visible.
Parking L g Lot ots Lot 11, ASU Tempe Campus
Surface T e Temper eratures es Surface temperature 06/09/2018 - Parking Lot 11 Details of the data 160 110 Day: June 9, 2018 Sky Harbor daytime high air temp: 108F 150 Sky Harbor morning low air temp: 79F 105 Sunrise: 5:18 am Surface Temperature (°F) 140 Sunset: 7:37 pm Air temperature (°F) 130 100 Surface Temperature - PV canopy 120 Surface Temperature - sun-exposed 95 110 Air Temperature - PV canopy Air temperature - sun-exposed 100 90 90 80 85 6:00 AM 9:00 AM 12:00 PM 3:00 PM 6:00 PM 9:00 PM Time of Day
Mean an Ra Radi diant T Tem emperatures MRT 06/09/2018 - Parking Lot 11 Details of the data Day: June 9, 2018 110 170 Sky Harbor daytime high air temp: 108F 160 Sky Harbor morning low air temp: 79F 105 Sunrise: 5:18 am 150 Sunset: 7:37 pm Air temperature (°F) 140 100 MRT (°F) MRT - PV canopy 130 MRT - sun-exposed 95 120 Air Temperature - PV canopy Air temperature - sun-exposed 110 90 100 90 85 6:00 AM 9:00 AM 12:00 PM 3:00 PM 6:00 PM 9:00 PM Time of Day
Parking L g Lot ots Key points: • Lot 11 has strong differences between sun-exposed and PV shaded areas for mean radiant temperature (MRT) of up to 40F. • Lot 11 shows also strong differences in the surrounding surface temperature underneath the instrument (up to 30F). • Lot 11 – differences for surface temperature and MRT are much slower or non-existent during the night hours
Con onclusions • Aligning research with City challenges and priorities requires common understanding of the challenge between city and academic partners including intention in how findings will be used to guide policy • Data can be integrated into existing City GIS database to map thermal performance of infrastructure at different times of days and seasons • Extreme heat’s subjective nature is different from other hazards (e.g. flooding) and thus thermal comfort and experience is a critical piece to integrate into any policy to improve resilience to extreme heat
Recommend
More recommend