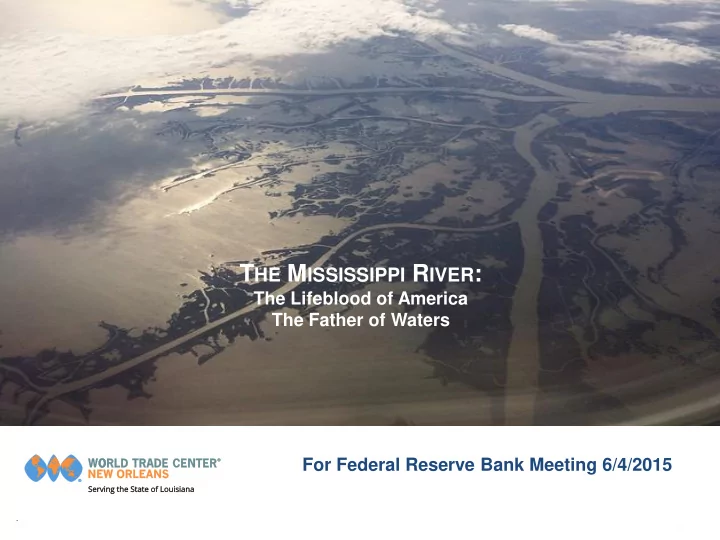

T HE M ISSISSIPPI R IVER : The Lifeblood of America The Father of Waters For Federal Reserve Bank Meeting 6/4/2015
3,896 miles in length 31 U.S. States and 2 Canadian provinces 4 th longest river in the world Upper Mississippi and Lower Mississippi River
H ISTORICAL I MPORTANCE OF THE M ISSISSIPPI Worlds largest waterway – the main economic artery of the Mid-America waterway system; Since its discovery always been a very important asset Cheaper to send freight from Cincinnati, Ohio, to the U.S. east coast via the Mississippi and the long sea passage from New Orleans than to transport it over the Appalachians;
C URRENT E CONOMIC I MPACT $200 billion generated annually by the Mississippi as a whole; 3 Approx. 40 million people living around the Mississippi River Almost 600 million tons of commodities shipped on the Mississippi River: – 470 million tons of commodities shipped on Lower Mississippi River/year ($6 billion in revenue and 29,000 jobs) 4 – 125 million tons of commodities shipped/year on Upper Mississippi River; 5 – 60% of U.S. Grain , 20% of Oil and Gas, 20% of Coal Shipments Over 1 million jobs rely on Mississippi’s transportation system: – 771,000 jobs depend on the Lower Mississippi alone; 2 52,600 farms on Upper Mississippi River Corridor: 6 – $5 billion/ year in revenue, employing 94,000 people; 2 Lower Mississippi Economic Conservation Committee, The Economic Profile of the Lower Mississippi River (Feb 2014), available at , http://www.lmrcc.org/wp- content/uploads/2014/02/LMR_Economic_Profile_February2014.pdf 3 Id. 4 WTC, Mississippi River Alliance, http://wtcmsra.org/ 5 Economic Profile of the Upper Mississippi River, Industrial Economics (March 1999), available at , http://nctc.fws.gov/Pubs3/economicprofile_miss99.pdf 6 Center for Global Environment Education, http://cgee.hamline.edu/rivers/Resources/Feature/feat1.htm 7 Id.
E CONOMIC I MPACT OF L OWER M ISSISSIPPI R IVER R EGION 10 Economic Sectors Table. Revenue and Employment in the Lower Mississippi Region dominate: Revenues Employment • Sector $ Million Percentage # People Percentage Manufacturing Harvest of Natural Resources 559 0.4% 13,726 2.3% • Tourism • Agri/Aquaculture Outdoor Recreation 1,335 0.9% 54,476 9.3% • Outdoor Recreation Tourism 15,501 10.2% 190,395 32.5% • Mineral Resources Water Supply 385 0.3% 601 0.1% • Navigation Agriculture and Aquaculture 8,737 5.8 56,102 9.6% • Harvest and Natural Mineral Resources 7,816 5.2% 41,443 7.1% Resources Energy 6,758 4.5% 2,730 0.5% • Energy Navigation 4,219 2.8% 18,764 3.2% • Water Supply Manufacturing 106, 394 70.1% 207,186 35.4% • Ecosystem Ecosystem Services Non-Market Unquantified Unquantified Total LMR: 151,703 100% 585,423 100% *Lower Mississippi Economic Conservation Committee, The Economic Profile of the Lower Mississippi River (Feb Lower Mississippi Economic Conservation Committee, The Economic Profile of the Lower Mississippi River (Feb 2014), available at , http://www.lmrcc.org/wp- content/uploads/2014/02/LMR_Economic_Profile_February2014.pdf
E CONOMIC I MPACT OF L OWER M ISSISSIPPI R IVER R EGION
M ANUFACTURING
T OURISM
A GRICULTURE
H ARVESTED N ATURAL R ESOURCES
N AVIGATION
E NERGY
E NVIRONMENTAL I MPACT OF L OWER M ISSISSIPPI R IVER R EGION 4 Lower Mississippi Economic Conservation Committee, The Economic Profile of the Lower Mississippi River (Feb 2014), available at , http://www.lmrcc.org/wp-content/uploads/2014/02/LMR_Economic_Profile_February2014.pdf
CONTACT Dominik Knoll CEO T: (504) 529-1601 E: dknoll@wtcno.org World Trade Center of New Orleans Baton Rouge Satellite Office Lafayette Satellite Office 365 Canal Street, Suite 1120 8550 United Plaza Blvd, Suite 702 128 Demanade Blvd New Orleans, LA 70130 USA Baton Rouge, LA 70809 Lafayette, LA 70503 www.wtcno.org (225) 590-3870 (337) 347-9375 Lake Charles Satellite Office Shreveport Satellite Office 4310 Ryan Street 500 Clyde Fant Parkway, Suite 200 Lake Charles, LA 70602 Shreveport, LA 71101 (337) 347-9376 (318) 302-4376
Recommend
More recommend