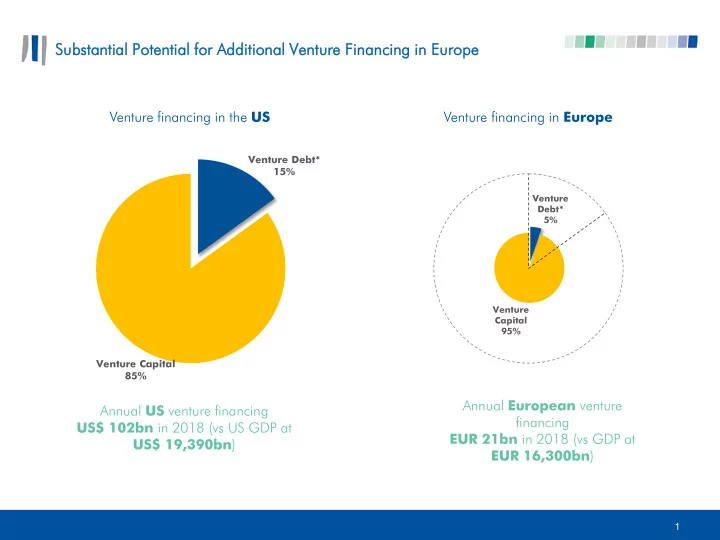

Substant antial al Potenti tial al for Additional nal Venture Financi ancing ng in E Europe Venture financing in the US Venture financing in Europe Venture Debt* 15% Venture Debt* 5% Venture Capital 95% Venture Capital 85% Annual European venture Annual US venture financing financing US$ 102bn in 2018 (vs US GDP at EUR 21bn in 2018 (vs GDP at US$ 19,390bn ) EUR 16,300bn ) 1
EIB Venture e Debt Signed d Transac sacti tions 2017 2019 2016 2018 2015 EUR 1,911 m EUR 1,878 m EUR 471 m EUR 1,186 m EUR 167 m 15 EU countries 10 EU countries 21 EU countries 22 EU countries 6 EU countries 2
EIB Venture e Debt Supports rts Highly Skilled d Jobs 2018 2017 2019 2015 2016 Total number of jobs supported: 6,336 Total number of jobs supported: 686 Total number of jobs supported: 25,522 Total number of jobs supported: 15,550 Total number of jobs supported: 24,755 212 jobs 458 jobs 6,000 jobs 6,046 jobs 3,775 jobs Medical Medical Biotechnology and LIFE SCIENCES technologies services drug development 2,578 jobs 474 jobs 10,147 jobs 10,868 jobs 6,196 jobs Software with IT Services ICT ICT emphasis on and Equipment cybersecurity e-commerce 8,608 jobs 8,608 jobs 5,579 jobs 3,300 jobs Advanced Energy and ENGINEERING manufacturing and Chemicals cleantech industrial innovation 3
Geograph raphic c Coverage ge Heat t Map Venture Capital vs Venture Debt EIB Venture Debt Venture Capital 2% UK % of total financing** 29% % of total financing* 24% FR 21% 23% DE 19% 2% ES 8% 5% NL 5% 8% SE 5% 1% BE 2% 8% FI 2% 5% IRL 2% 3% AT 2% 6% IT 2% 1% DK 1% 0% PL 1% 1% HU 0% 11% Others 1% 4
Recommend
More recommend