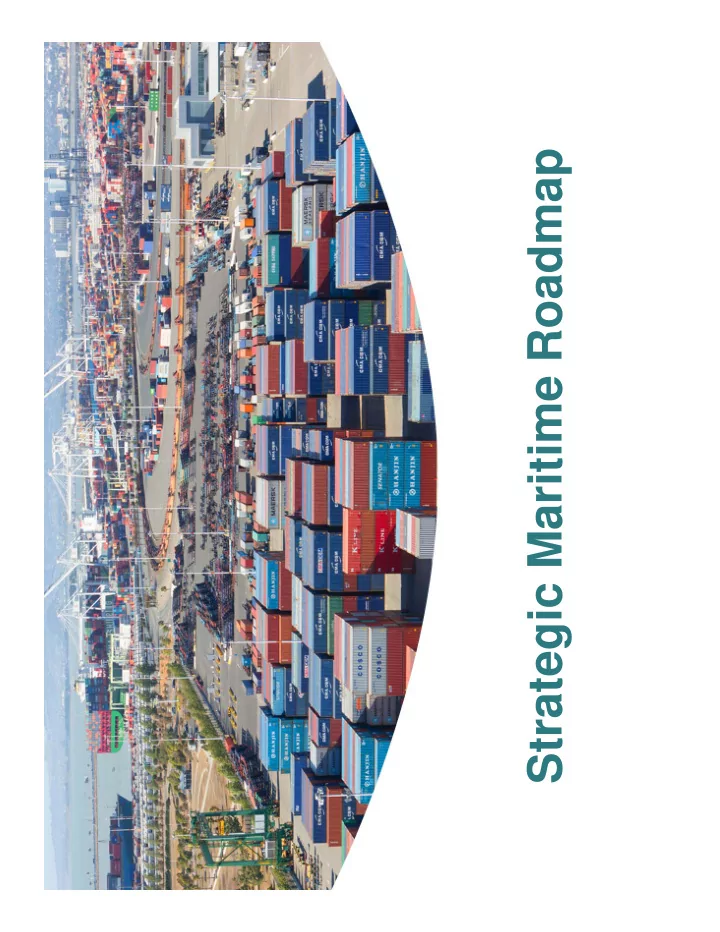

Strategic Maritime Roadmap
Overview Operational Stability Key Industry Trends Commercial Strategy Land Use Strategies Conclusion 2
3 2017 – 2022 are forecasts Operational Stability Today vs. 2015
Marine Terminal Improvements $50 million in TraPac Terminal $104 million in Oakland International Container Terminal $28 million in Ben E. Nutter Terminal Extended Gate Hours Appointment Systems Off-Dock Container Yard 4
Trends Impacting Ports GDP growth along with Ocean Carrier changes and trends Carrier Alliances & Consolidation Vessel Size Freight Rates Terminal Stakes drive a Port’s infrastructure demands 5
Ocean Carrier Alliances & Consolidation Despite major realignment of ocean carrier alliances in early 2017, the Port has maintained operational stability and terminal throughput.
Vessel Size Increasing vessel size has implications for yard and berth space requirements 7
Vessel Size What does it mean for Oakland? Over the next fifteen years, the average size of the Trans-Pacific vessels calling Oakland is expected to grow by over 35% . Ships will average over 10,000 TEUs. Vessel Size 2017 2021 2026 2031 < 5,000 TEUs 11 7 5 6 Between 5,000 – 9,999 TEUs 14 16 15 14 Between 10,000 – 13,999 TEUs 3 6 9 11 Between 14,000 – 17,999 TEUs 1 1 3 0 > 18,000 TEUs 0 0 1 0 Total No. of Vessel Services 29 30 33 31 Avg T/P Vessel Size, in TEUs 7,789 9,367 10,386 10,556 8
Vessel Size Infrastructure Demands Crane Raising 9
Freight Rates After hitting the lowest levels seen in years, freight rates are on the rise after a series of mergers, acquisitions and one bankruptcy. Source: Shanghai Shipping Exchange 10
Strategy - Commercial Serve and grow our local & regional market Maintain market leader position in Central Valley exports Increase mid-western grain & frozen protein exports Develop logistics facilities – Seaport Logistics Complex & Cool Port – for incremental over-the-dock cargo Increase discretionary intermodal cargo to 15% Grow refrigerated exports by 10% and imports by 5% Explore automotive import growth opportunities Cargo recapture, especially Utah / Colorado market Continue to pursue First Inbound Vessel Call – PETF workgroup 11
Strategy - Commercial Distribution & Warehouse Space “It is unclear if industrial real estate development can keep up with demand. National vacancy rates in the first quarter hit a 17-year low and average rental rates are up 10 percent from a year ago in the hottest coastal markets.” Bill Mongelluzzo, Senior Editor | Jun 13, 2017 6:20PM EDT 12
Strategy – Land Use Operations & Infrastructure Needs Off-Dock Truck Bollards, Container Staging & Fenders & Fumigation Yards Parking Wharves Container & Transload & Chassis Crossdock Cranes Shore Power Storage Services Near Dock & Traffic Warehousing Short Haul Customs Management Rail 13
Strategy – Land Use Finite water and land holdings Capacity Diversification Velocity , complex-wide 14
Largest 21,000 8,000 TEUs Containership TEUs Number of 11 6 terminals Marine Terminals terminals 2.37 million 1.69 million TEUs Handled TEUs TEUs Number of Ocean 25 44 Carriers Average Terminal 153 acres 49 acres Size Largest Marine 271 acres 81 acres Terminal 15
Largest 21,000 8,000 TEUs Containership TEUs Number of 11 6 terminals Marine Terminals terminals 2.37 million 1.69 million TEUs Handled TEUs TEUs Number of Ocean 25 44 Carriers Average Terminal 153 acres 49 acres Size Largest Marine 271 acres 81 acres Terminal 16
Recommend
More recommend