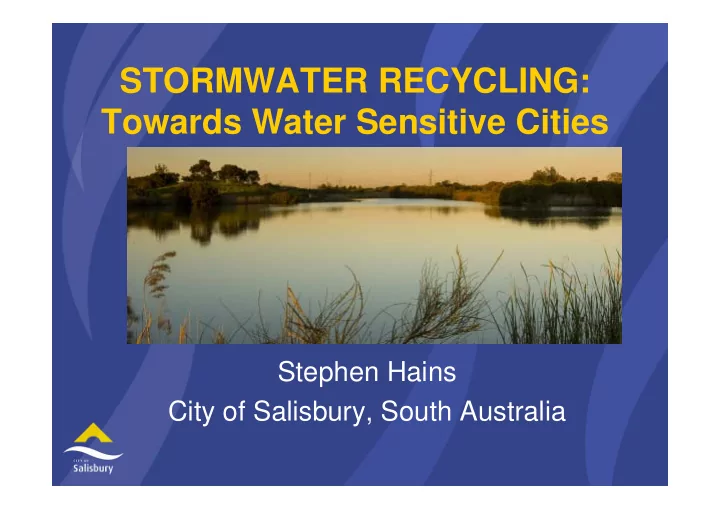

STORMWATER RECYCLING: Towards Water Sensitive Cities Stephen Hains City of Salisbury, South Australia
The emerging water crisis in southern Australia
Step change in Australian Annual Total Rainfall 1900-2008 1970-2008
EC Level 3500 3000 2500 2000 1500 1000 500 0 8/03/2008 7/02/2008 8/01/2008 5 day avg EC Levels 9/12/2007 9/11/2007 10/10/2007 10/09/2007 11/08/2007 12/07/2007 12/06/2007 13/05/2007 Lake Alexandrina Water Level and Salinity 2004-2008 13/04/2007 14/03/2007 12/02/2007 0.35m AHD 13/01/2007 14/12/2006 14/11/2006 15/10/2006 15/09/2006 16/08/2006 17/07/2006 17/06/2006 Full Supply Level 18/05/2006 18/04/2006 19/03/2006 17/02/2006 Date 18/01/2006 19/12/2005 19/11/2005 20/10/2005 20/09/2005 21/08/2005 Surcharge Level 22/07/2005 22/06/2005 23/05/2005 23/04/2005 24/03/2005 22/02/2005 23/01/2005 24/12/2004 24/11/2004 25/10/2004 5 day avg lake level 25/09/2004 26/08/2004 27/07/2004 27/06/2004 Figure 2 .1 3 28/05/2004 28/04/2004 29/03/2004 28/02/2004 29/01/2004 30/12/2003 1.00 0.95 0.90 0.85 0.80 0.75 0.70 0.65 0.60 0.55 0.50 0.45 0.40 0.35 0.30 0.25 0.20 0.15 0.10 0.05 0.00 -0.05 -0.10 -0.15 -0.20 -0.25 -0.30 -0.35 -0.40
The emerging water crisis in southern Australia
Salisbury Landform
Stormwater Detention
Wetlands – Habitat and conservation
The Barker Inlet & the Port River Estuary
Wetlands & water cleansing In wet season, stormwater is detained in small basins and dams Stormwater is controlled to move slowly through wetlands: This results in reduction of; •Nutrient loads •Gross pollutants •Heavy metals
Aquifer Storage and Recovery (ASR) Storm/Waste-water to aquifer in wet season Recovery from aquifer in dry season Stormwater and/or Stormwater Injection Irrigation Wastewater Well Wetland/Basin Sewage Sewage Treatment W e t S e a s o n Groundwater Level n s o e a S y r D Natural Recharge Confining Layer Aquifer GRAPHICS BY CSIRO LAND & WATER
Aquifer Storage and Recovery (ASR) Storm/Waste-water to aquifer in wet season Recovery from aquifer in dry season Stormwater and/or Stormwater Injection Irrigation Wastewater Well Wetland/Basin Sewage Sewage Treatment W e t S e a s o n Groundwater Level o n a s e y S r D Natural Recharge Confining Layer Aquifer GRAPHICS BY CSIRO LAND & WATER
Aquifer Storage & Recovery
M a x w e l l R o a d Recharge Bore Bridge Road Sports Fields
Industrial Applications
Environmental Benefits Paddocks Wetland
Current Position � 53 Wetlands; 16 ASR Bores; Detention dams � Adelaide water consumption – 200Gl – 80Gl from Murray; 180Gl in dry year � Stormwater flowing through Salisbury 33Gl – Currently capture 5Gl – Selling 1.5Gl – Plan to capture 14Gl within 5 years
Water distribution
Capital Investment Other, $1.4m Commonwealth, $20.3m Council, $17.2m State, $13.0m
Recycled Water Users Education Residential 4% 5% Industry 41% Council Reserves 50%
Mawson Lakes
ASR Mixing Tank
Springbank Waters Springbank Waters ASR
Water Business Unit � Carries all debt, water asset management and operational expenses � Purchases staff time from Council � Receives all revenue � Internal Board � Business case prepared for all new investment – Strong positive cash flow within 5 years
Gross Revenue Forecasts 4.5 4 3.5 3 Millions 2.5 2 1.5 1 0.5 0 08/09 09/10 10/11 11/12 12/13 Financial Year
Adelaide Water Supply 2008 URBAN ADELAIDE Total Average 216Gl Total Dry Year 216Gl Waterproofing Adelaide – A Thirst for Change
Aquifer Storage Opportunities GROUND WATER OPPORTUNITIES
SURFACE WATER Surface Water OPPORTUNITIES Opportunities SYSTEM POTENTIAL (GL pa) Gawler 20 20 Northern Adelaide 20 20 Barker 12 6 Torrens 15 15 Patawalonga 12 12 Brighton 5 5 Southern Adelaide 22 22 TOTAL 100 106
WaterWise Adelaide Model WaterWise Adelaide Total Water Use: 365 Gl Scheme Model
Evolving Urban Water Hydro- -Social Contract Social Contract Evolving Urban Water Hydro Cumulative Socio-Political Drivers Public health Flood Social amenity, Water supply protection protection environmental access & protection security Water Supply Sewered Drained Waterways Water Cycle Water Sensitive City City City City City City Point & diffuse Separate source pollution Supply sewerage Drainage, management hydraulics schemes channelisation Service Delivery Functions Brown et al (2008).
Evolving Urban Water Hydro- -Social Contract Social Contract Evolving Urban Water Hydro Cumulative Socio-Political Drivers Public health Flood Social amenity, Limits on natural Water supply protection protection environmental resources access & protection security Water Supply Sewered Drained Waterways Water Cycle Water Sensitive City City City City City City Diverse, fit-for- purpose sources & Point & diffuse end-use efficiency, Separate source pollution waterway health Supply sewerage Drainage, management restoration hydraulics schemes channelisation Service Delivery Functions Brown et al (2008).
Evolving Urban Water Hydro- -Social Contract Social Contract Evolving Urban Water Hydro Cumulative Socio-Political Drivers Intergenerational Public health Flood Social amenity, Limits on natural Water supply equity, resilience protection protection environmental resources access & to climate change protection security Water Supply Sewered Drained Waterways Water Cycle Water Sensitive City City City City City City Adaptive, multi- functional Diverse, fit-for- infrastructure & purpose sources & Point & diffuse urban design end-use efficiency, Separate source pollution reinforcing water waterway health Supply sewerage Drainage, management sensitive values & restoration hydraulics schemes channelisation behaviours Service Delivery Functions Brown et al (2008), and Wong and Brown (2008)
Conclusions
Recommend
More recommend