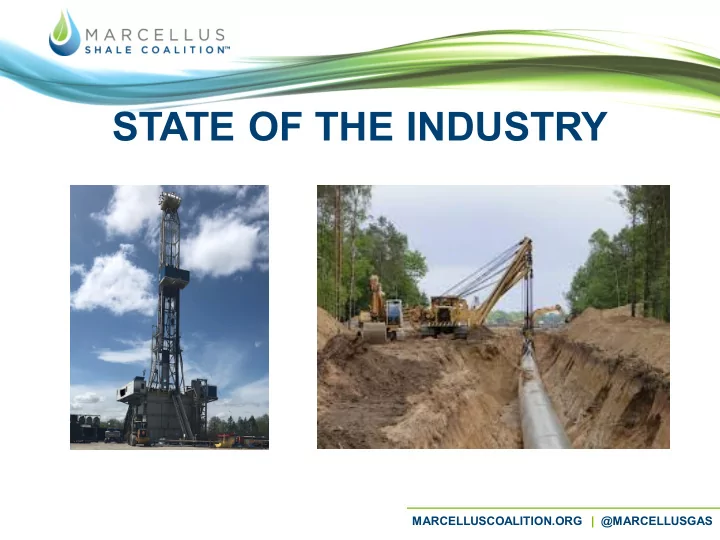

STATE OF THE INDUSTRY MARCELLUSCOALITION.ORG | @MARCELLUSGAS
About MSC Our Membership • 125 diverse members Associate • Producers, midstream and suppliers Members are an integral part of Our Focus the MSC and the More than 95% of • Long-term development industry's robust the natural gas in supply chain. • End use opportunities Pennsylvania is produced by MSC • Addressing landowner and member public issues The MSC Board companies. • Maximizing benefits to secure our of Directors consists of 27 region’s energy future major producer and midstream companies in the Appalachian Basin. 2 MARCELLUSCOALITION.ORG | @MARCELLUSGAS MARCELLUSCOALITION.ORG | @MARCELLUSGAS
Drilling Activity in PA 3 MARCELLUSCOALITION.ORG | @MARCELLUSGAS
Pennsylvania: A World-Class Player in Shale Gas Production 2 nd largest natural gas producer in U.S. Over 9,400 producing wells 6.12 Trillion Cubic Feet (2018) 19% of total U.S. natural gas production 33 of 67 counties with at least 1 producing well 4 MARCELLUSCOALITION.ORG | @MARCELLUSGAS
5 MARCELLUSCOALITION.ORG | @MARCELLUSGAS
Fueling the Nation 52% 11% 92% 31% 13% 5% 14% 6 MARCELLUSCOALITION.ORG | @MARCELLUSGAS
Pricing 7 MARCELLUSCOALITION.ORG | @MARCELLUSGAS
PA Price Differential 8 * November 2019 Monthly Bidweek Price – Platts Inside FERC MARCELLUSCOALITION.ORG | @MARCELLUSGAS
Closing the Gap PA v NYMEX Price 2015 - 2018 $3.50 60% 55% $3.09 $3.00 50% $2.62 $2.47 $2.50 40% $2.00 $ per MCF 30% $1.50 $1.18 20% 20% $1.00 10% $0.50 $0.00 0% 2015 2016 2017 2018 PA Price NYMEX Price PA Discount 9 Source: Platts Inside FERC (note: price reflects final annual MARCELLUSCOALITION.ORG | @MARCELLUSGAS average for each year – not price fluctuations within the year)
Consumer & Economic Benefits 10 MARCELLUSCOALITION.ORG | @MARCELLUSGAS
Benefiting Consumers Lower Prices = Customer Savings Wholesale electric prices down 41% since 2008 Natural gas prices for end-use customers down 56% - 76% since 2008 Average annual savings > $1,100 - $2,200 per household 11 MARCELLUSCOALITION.ORG | @MARCELLUSGAS
Benefiting Consumers Lower Prices = Customer Savings 2008 - 2018 Customer Utility PGC Rate / mcf % Change Savings** 2008* 2018* 2008-2018 Annual PECO $13.16 $5.05 - 62% $1,460 NFG $10.86 $4.50 - 59% $1,145 PGW $13.02 $3.62 - 72% $1,692 Columbia $15.94 $3.84 - 76% $2,178 UGI $13.26 $5.89 - 56% $1,327 UGI Penn $11.68 $4.33 - 63% $1,323 $15.89 $4.53 - 71% $2,045 Peoples/Equitable * PUC Purchased Gas Cost (PGC) Rate in Effect Prior to Annual Review: 2008 & 2017 ** Residential heating customer using 15 MCF/month 12 MARCELLUSCOALITION.ORG | @MARCELLUSGAS
Getting Gas to Market 13 MARCELLUSCOALITION.ORG | @MARCELLUSGAS
Moving Gas to Market 14 MARCELLUSCOALITION.ORG | @MARCELLUSGAS
Moving Gas to Market Investment Capacity Pipeline Project* (Millions) (MMcf/day) Adelphia Gateway Undetermined 250 Atlantic Sunrise $2,100 650 Birdsboro $47 79 Constitution $683 650 Eastern Panhandle Exp. $250 47.5 Eastern Shore Exp. Project $98.6 400 Empire North $141 205 Leidy South Undetermined 580 Monaca Line $20 133 Northeast Supply Enhancement $927 400 Northern Access $500 490 Orion $109 135 PennEast $1,000 1,107 Risberg Line $86 55 15 Supply Header $500 1,511 Source: Energy in Depth – Appalachian Basin MARCELLUSCOALITION.ORG | @MARCELLUSGAS *FERC Project – approved or under review
Moving Gas to Market 16 MARCELLUSCOALITION.ORG | @MARCELLUSGAS
Sophisticated and Well- Funded Opposition 17 MARCELLUSCOALITION.ORG | @MARCELLUSGAS
18 MARCELLUSCOALITION.ORG | @MARCELLUSGAS
Moving Gas to Market Investment Capacity Pipeline Project* (Millions) (MMcf/day) Adelphia Gateway Undetermined 250 Atlantic Sunrise $2,100 650 Birdsboro $47 79 Constitution $683 650 Eastern Panhandle Exp. $250 47.5 Eastern Shore Exp. Project $98.6 400 Empire North $141 205 Leidy South Undetermined 580 Monaca Line $20 133 Northeast Supply Enhancement $927 400 Northern Access $500 490 Orion $109 135 PennEast $1,000 1,107 Risberg Line $86 55 19 Supply Header $500 1,511 Source: Energy in Depth – Appalachian Basin MARCELLUSCOALITION.ORG | @MARCELLUSGAS *FERC Project – approved or under review
Benefiting Consumers 20 MARCELLUSCOALITION.ORG | @MARCELLUSGAS
Not…Benefiting New England Consumers 21 Source: U.S. Chamber of Commerce – Global Energy Institute MARCELLUSCOALITION.ORG | @MARCELLUSGAS 2018 Average Retail Electricity Prices
Wasn’t Always that Way 22 MARCELLUSCOALITION.ORG | @MARCELLUSGAS
Operation Paukenschlag “American Shooting Season” 23 MARCELLUSCOALITION.ORG | @MARCELLUSGAS
24 MARCELLUSCOALITION.ORG | @MARCELLUSGAS
25 MARCELLUSCOALITION.ORG | @MARCELLUSGAS
The Tulsa Project Big Inch – 24” line stretching 1254 miles • Over 300k barrels of crude a day Little Inch – 20” line stretching 1475 miles • Over 200k barrels of gasoline a day 26 MARCELLUSCOALITION.ORG | @MARCELLUSGAS
27 MARCELLUSCOALITION.ORG | @MARCELLUSGAS
28 MARCELLUSCOALITION.ORG | @MARCELLUSGAS
Engineering Marvel 16,000 workers Big Inch construction: 8/3/42 – 8/14/43 Little Inch construction: 4/23/43 – 10/8/43 29 MARCELLUSCOALITION.ORG | @MARCELLUSGAS
30 MARCELLUSCOALITION.ORG | @MARCELLUSGAS
31 MARCELLUSCOALITION.ORG | @MARCELLUSGAS
ENERGY TRANSFER $456M SPENT TO MAINTAIN AND IMPROVE INFRASTRUCTURE ASSETS IN 2018 +86K MILES OF ENERGY INFRASTRUCTURE NATIONWIDE ~30% OF THE NATION'S NATURAL GAS AND CRUDE OIL MOVED ON ET PIPELINES 32 MARCELLUSCOALITION.ORG | @MARCELLUSGAS
Community Engagement 33 MARCELLUSCOALITION.ORG | @MARCELLUSGAS
Recommend
More recommend