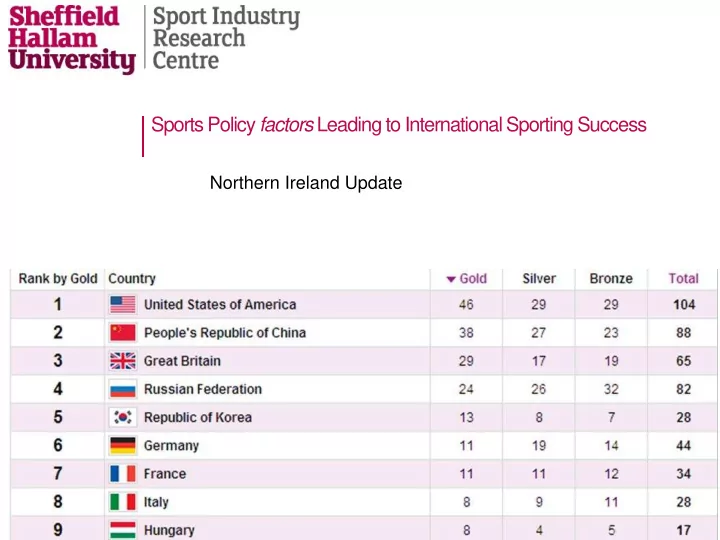

Sports Policy factors Leading to International Sporting Success Northern Ireland Update
Presentation Overview 1. The SPLISS project 2. Northern Ireland headlines 3. Early benchmarking data 4. Success in elite sport
The SPLISS Project
Northern Ireland Headlines
Financial Support for Sport in NI (General)
Financial Support for Sport in NI (Elite)
Investment by Pillar
Prioritisation of Funding? Year Top 5 (£s) Top 5 (%) Top 10 (£s) Top 10 (%) 2007 £548,044 46% £846,179 71% 2008 £501,317 41% £805,753 65% 2009 £890,836 50% £1,379,617 77% 2010 £1,089,131 45% £1,762,729 73%
Pillar 2 • Coordination of financial inputs (4/5) • Elite sport at local level (3/5) • Elite sport and sport for all (3/5) • Politics and sport (3/5)
What do Stakeholders Think? National National Olympic Communication Club Governing Government Sports Committee Body Institute n = 82 92 60 44 82 Poor 4.9% 6.5% 26.7% 13.6% 4.9% Not good 3.7% 13.0% 18.3% 20.5% 4.9% Reasonable 18.3% 37.0% 36.7% 34.1% 28.0% Good 45.1% 32.6% 16.7% 25.0% 47.6% Excellent 28.0% 10.9% 1.7% 6.8% 14.6% 100% 100% 100% 100% 100%
Pillar 4 Talent Identification No nationally coordinated programme "We have had an all-Ireland talent transfer programme for track cycling with true elite athletes, we've got two who are in the system and they are still trying to qualify for the Olympics next summer but that was a specific project, it's not an on- going thing". Engagement by schools is patchy
Pillar 5 • 19% of athletes receive a contribution to living costs • 63% receive other reimbursements • Average financial support £5,227 • Average reimbursements £6,690; • Average sponsorship: £2,500 • Average prize money: £791.
Pillars 6,7,8,and 9 • Limited dedicated facilities for elite sport • Big variations in coaches’ pay • Coaches subsidise their own activities • Events programme remote from elite sport • No specialist unit for research and innovation
Early Benchmarking Data
SPLISS 2: Progress (1)
SPLISS 2: Progress (2)
SPLISS 2: Progress (3)
Success in Elite Sport
20 15 10 5 Change in Total Medals Won 0 -5 -10 -15 -20 All Other NOCs -25 -15 -10 -5 0 5 10 15 Change in Gold Medals Won
60 50 40 30 20 Change in Total Medals Won 10 0 -12 -10 -8 -6 -4 -2 0 2 4 6 8 10 12 14 16 18 -10 -20 -30 -40 -50 Change in Gold Medals Won
Market Concentration 2 nd Most Most 3rd Most Successful Successful Successful Total Northern Ireland 43% Boxing 18% Athletics 18% Lawn Bowls 79% India 28% Shooting 27% Weightlifting 20% Wrestling 75% Malaysia 33% Badminton 19% Weightlifting 15% Shooting 67% South Africa 26% Swimming 25% Athletics 10% Shooting 61% Australia 30% Swimming 21% Athletics 9% Cycling 60% Wales 23% Weightlifting 21% Athletics 12% Boxing 56% England 27% Athletics 18% Swimming 9% Shooting 54% Scotland 17% Swimming 17% Athletics 16% Boxing 51% Canada 24% Swimming 18% Athletics 9% Gymnastics 51% New Zealand 21% Athletics 15% Cycling 14% Swimming 50%
Bangladesh -2.7 Mauritius -1.4 Isle of Man -1.2 Papua New Guinea -0.8 St. Lucia -0.8 Pakistan -0.8 Sri Lanka -0.8 Cayman Islands -0.8 Namibia -0.6 Trinidad & Tobago -0.4 Botswana -0.4 Northern Ireland -0.4 Canada -0.2 Seychelles -0.1 Wales -0.1 Ghana -0.1 Bahamas -0.1 Scotland -0.1 Cameroon 0.0 Singapore 0.0 Guyana 0.1 Uganda 0.1 Cyprus 0.2 England 0.3 South Africa 0.3 New Zealand 0.4 Malaysia 0.5 St. Vincent & The Grenadines 0.6 Jamaica 0.6 Tonga 0.6 Australia 0.8 Nigeria 1.0 India 1.1 Nauru 1.1 Samoa 1.9 Kenya 2.0 -3 -2 -1 - 1 2 3
2014 Performance Goal • “Expected' market share in 2014 = 1.6% • Events in Glasgow = 244 • Medal points available =1,488 • Market share of 1.6% in 2014 = 24 points • Par score = 3-4 Gold, 3-4 Silver, and 6 Bronze
Thanks for listening...... Any questions? Simon Shibli Sport Industry Research Centre Sheffield Hallam University Collegiate Hall Collegiate Campus Sheffield S10 2BP Tel: +44 114 225 5920 Email: s.shibli@shu.ac.uk
Recommend
More recommend