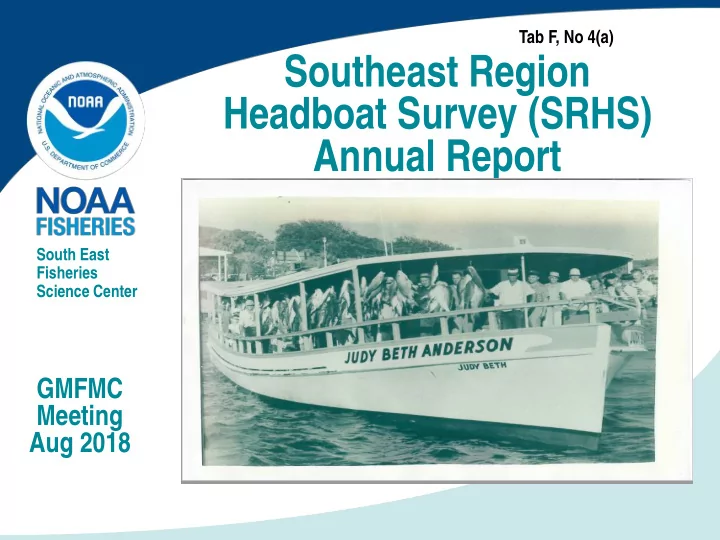

Tab F, No 4(a) Southeast Region Headboat Survey (SRHS) Annual Report South East Fisheries Science Center GMFMC Meeting Aug 2018
Southeast Regional Headboat Survey Annual Report • Introduction • Purpose – share information (trends in data) • Intended audience (headboat operators, Councils, SEDARS, etc.) • Includes most recent annual data - 2017 U.S. Department of Commerce | National Oceanic and Atmospheric Administration | NOAA Fisheries | Page 2
Report format and content • Introduction and metadata • Tables • Total landings by species numbers and weight • Effort – angler days 1986 to present • Summary of dockside sampling • Species summary (1 page per species) • 50 species – federally managed and species of interest U.S. Department of Commerce | National Oceanic and Atmospheric Administration | NOAA Fisheries | Page 3
List of Gulf of Mexico species Almaco Jack Gray Triggerfish Sand tilefish • • • Graysby Atlantic spadefish Saucereye porgy • • • Greater Amberjack Banded rudderfish Scamp • • • Hogfish Banks sea bass Silk Snapper • • • Jolthead progy Bar jack • Snowy Grouper • • King Mackerel Blackfin tuna • Spanish Mackerel • • Knobbed Porgy • Black Grouper Speckled Hind • • Lane Snapper • Black Sea Bass Tilefish • • Lesser amberjack • Bluefish Tomtate • • Little tunny • Vermilion Snapper Blueline Tilefish • • Margate • Cero Warsaw Grouper • • Mutton Snapper • Cobia White Grunt • • Red Grouper • Cubera snapper Whitebone porgy • • Red Hind • Dog snapper Yellowedge grouper • • Red Porgy • Yellowtail Snapper Dolphin fish • • Red Snapper • Gag Yellowmouth grouper • • Rock hind • Gray snapper • U.S. Department of Commerce | National Oceanic and Atmospheric Administration | NOAA Fisheries | Page 4
Species example – Vermilion snapper landings and discards Annual landings in number and weight (lb). Annual discards in number by region. Year Landings(n) Landings (lb) 2008 222,333 187,065 2009 300,275 300,512 2010 222,544 207,624 2011 446,064 451,089 2012 304,377 283,135 2013 342,271 302,120 2014 365,398 330,091 2015 366,188 338,868 2016 407,103 311,781 2017 474,098 430,522 U.S. Department of Commerce | National Oceanic and Atmospheric Administration | NOAA Fisheries | Page 5
Species Example – Vermilion snapper (Dockside Sampling, Effort Summary and CPUE) Dockside intercept sampling program summary by region and 5 year and 10 year cumulative averages. Region Len. (n) Wgt. (n) Avg.len(in.) Avg.wgt(lbs) nwFL 2,436 2,414 12.9 1.0 swFL 64 64 14.5 1.4 TX 2,245 1,957 13.3 1.1 GOM (5 yr) 32,339 30,937 12.6 0.9 GOM (10 yr) 47,435 45,684 12.7 0.9 Regionalsummaryofallpositive(caught and discarded) headboat trips for last ten years. Year southwest FL northwest FL MS to TX 2008 100 2,026 224 2009 109 2,262 442 2010 82 1,426 557 2011 142 2,448 569 2012 151 2,403 534 2013 156 2,585 580 2014 208 2,857 464 2015 249 2,742 571 2016 212 2,962 509 2017 300 3,092 409 U.S. Department of Commerce | National Oceanic and Atmospheric Administration | NOAA Fisheries | Page 6
U.S. Department of Commerce | National Oceanic and Atmospheric Administration | NOAA Fisheries | Page 7
Summary • Annual release date – Second quarter of following year to include previous fishing year estimated landings and effort • Feedback is welcome • Acknowledgements • Questions or comments U.S. Department of Commerce | National Oceanic and Atmospheric Administration | NOAA Fisheries | Page 8
Recommend
More recommend