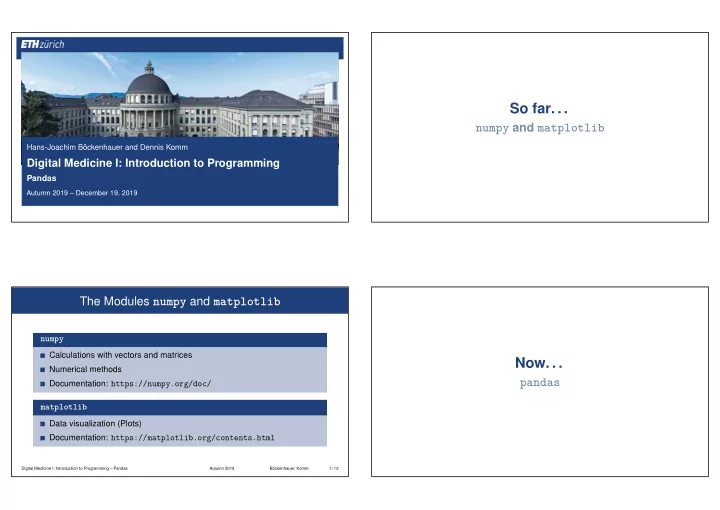

So far. . . numpy and matplotlib Hans-Joachim Böckenhauer and Dennis Komm Digital Medicine I: Introduction to Programming Pandas Autumn 2019 – December 19, 2019 The Modules numpy and matplotlib numpy Calculations with vectors and matrices Now. . . Numerical methods pandas Documentation: https://numpy.org/doc/ matplotlib Data visualization (Plots) Documentation: https://matplotlib.org/contents.html Digital Medicine I: Introduction to Programming – Pandas Autumn 2019 Böckenhauer, Komm 1 / 12
The Module pandas The Module pandas Import pandas analogously to numpy and matplotlib pandas import pandas as pd Processing of large sets of data Read in CSV file and store it in a special data type pandas dataframe (instead Allows a functionality similar to Excel of Python list or numpy array) Documentation: https://pandas.pydata.org/pandas-docs/stable/ data = pd.read_csv("daten.csv") Project 3: Reading in and processing CSV file “manually” Files in Excel format can be read in analogously pandas contains data structures and functions for this data = pd.read_excel("daten.xlsx") Digital Medicine I: Introduction to Programming – Pandas Autumn 2019 Böckenhauer, Komm 2 / 12 Digital Medicine I: Introduction to Programming – Pandas Autumn 2019 Böckenhauer, Komm 3 / 12 Exercise – Air Measurements Air measurements Copy the data file from project 3 Air Measurements using pandas ugz_luftqualitaetsmessung_seit-2012.csv Read in the CSV file and output its content To this end, use read_csv() and print() Digital Medicine I: Introduction to Programming – Pandas Autumn 2019 Böckenhauer, Komm 4 / 12
Air Measurements Reading in and Processing CSV Files Extract data import pandas as pd Numerical data starts from line 5 data = pd.read_csv("ugz_luftqualitaetsmessung_seit-2012.csv") Selection from line 5 We are only interested in the first 3 columns print(data) and columns 0 to 2 Rename columns We want to change column names Accessing individually cells using data.iloc import pandas as pd Same functionality as lists data = pd.read_csv("ugz_luftqualitaetsmessung_seit-2012.csv") newdata = data.iloc[5:, 0:3] print(data.iloc[5]) Output line 5 newdata = newdata.rename(columns={"Zürich Stampfenbachstrasse": "SO2", \ print(data.iloc[0:10]) Output lines 0 to 9 "Zürich Stampfenbachstrasse.1": "CO"}) print(data.head(3)) Output lines 0 to 2 newdata.to_csv("messungen.csv") print(data.iloc[8, 0]) Output line 8, column 0 Digital Medicine I: Introduction to Programming – Pandas Autumn 2019 Böckenhauer, Komm 5 / 12 Digital Medicine I: Introduction to Programming – Pandas Autumn 2019 Böckenhauer, Komm 6 / 12 Reading in and Processing CSV Files Reading in and Processing CSV Files Filtering data Accessing data using the column names Use loc instead of iloc in order to specify conditions Output all column names as list print(data.loc[data["Datum"] == "2014-12-19"]) print(data.columns) Combination of different Boolean expressions Parentheses around single expressions Output column “Datum” & instead of and print(data["Datum"]) | instead of or ~ instead of not Output column “Zürich Stampfenbachstrasse – Kohlenmonoxid” print(data.loc[(data["Datum"] == "2014-12-19") \ print(data["Zürich Stampfenbachstrasse.1"]) | (data["Datum"] == "2014-12-20")]) Digital Medicine I: Introduction to Programming – Pandas Autumn 2019 Böckenhauer, Komm 7 / 12 Digital Medicine I: Introduction to Programming – Pandas Autumn 2019 Böckenhauer, Komm 8 / 12
Reading in and Processing CSV Files Exercise – Air Measurements Filtering data Air measurements Convert strings to rational numbers ( float ) Extract all CO entries from newdata for newdata["SO2"] = newdata["SO2"].astype(float) which the SO2 value is smaller than 0.1 or newdata["CO"] = newdata["CO"].astype(float) larger than 0.25 Use relation operators to filter Convert the CO entries into a Python list print(newdata.loc[newdata["SO2"] > 0.1]) using list() Combine different Boolean expressions Plot the values using matplotlib print(newdata.loc[(newdata["SO2"] > 0.1) & (newdata["SO2"] < 0.4)]) Choose columns with second argument print(newdata.loc[newdata["SO2"] > 0.2, "Datum"]) Digital Medicine I: Introduction to Programming – Pandas Autumn 2019 Böckenhauer, Komm 9 / 12 Digital Medicine I: Introduction to Programming – Pandas Autumn 2019 Böckenhauer, Komm 10 / 12 Reading in CSV File import pandas as pd import matplotlib.pyplot as plt data = pd.read_csv("ugz_luftqualitaetsmessung_seit-2012.csv") Pandas newdata = data.iloc[5:, 0:3] Further Functionality newdata = newdata.rename(columns={"Zürich Stampfenbachstrasse": "SO2", \ "Zürich Stampfenbachstrasse.1": "CO"}) newdata["SO2"] = newdata["SO2"].astype(float) newdata["CO"] = newdata["CO"].astype(float) newdata = newdata.loc[(newdata["SO2"] < 0.1) | (newdata["SO2"] > 0.25), "CO"] datalist = list(newdata) plt.plot(datalist) plt.show() Digital Medicine I: Introduction to Programming – Pandas Autumn 2019 Böckenhauer, Komm 11 / 12
Further Functionality Delete columns del data["Column"] Add columns data["Sum"] = data["Column 1"] + data["Column 2"] Sort data data = data.sort_values("Column") . . . Digital Medicine I: Introduction to Programming – Pandas Autumn 2019 Böckenhauer, Komm 12 / 12
Recommend
More recommend