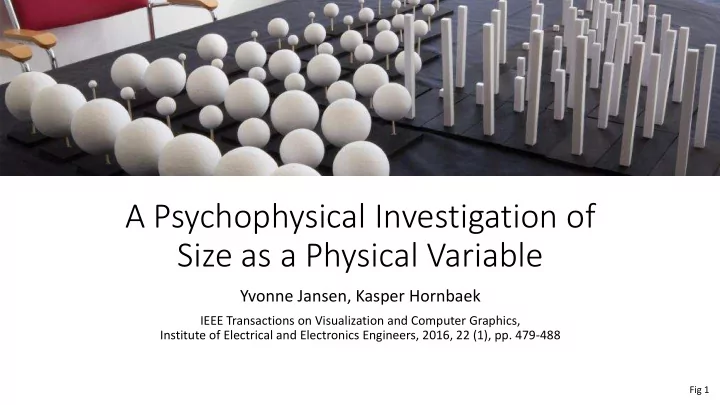

A Psychophysical Investigation of Size as a Physical Variable Yvonne Jansen, Kasper Hornbaek IEEE Transactions on Visualization and Computer Graphics, Institute of Electrical and Electronics Engineers, 2016, 22 (1), pp. 479-488 Fig 1
What is data physicalization? “computer -supported physical representations of data can support cognition, communication, learning, problem solving, and decision making” Data Visualizations Data Physicalizations Visual Variables Physical Variables Van den Elzen and Wijk, Multivariate Network Exploration and Presentation , 2014 Hsiang and Mendis, City of 7 Billion , 2015
Why data physicalization? • information retrieval in comparison to on-screen 3D visualizations • memorability of data compared to paper viz Nobel Museum Exhibition , 2016 Hsiang and Mendis, City of 7 Billion , 2015
Why data physicalization? 3D printing, laser cutting, mechanical actuation, shape-changing technology, TUIs (tangible user interfaces) Tangible Media Group, inFORM, MIT Media Lab, ongoing
Why data physicalization? 3D printing, laser cutting, mechanical actuation, shape-changing technology, TUIs (tangible user interfaces) Tangible Media Group, inFORM, MIT Media Lab, ongoing Taher et al., EMERGE , 2015
What is psychophysics? Psychophysics quantitatively investigates the relationship between physical stimuli and the sensations and perceptions they produce Lu and Dosher, Visual Psychophysics , 2013
Why Psychophysics? Stevens’ Power Law: relationship between the magnitude of a stimulus and its perceived intensity or strength, some are magnified (electric shock), others are compressed (brightness) and some are completely accurate (length) Munzer, Visualization Analysis and Design , 2014
Why psychophysics? Visual Variables Physical Variables ??? Munzer, Visualization Analysis and Design , 2014
Haptic Psychophysics Kahrimanovic et al., Haptic perception of volume and surface area of 3-D objects , 2010
Questions 1. How accurately are elementary shapes estimated? 2. How similar are estimates between individuals? 3. Are estimates systematically biased?
Methods • Bars vary in one dimension, spheres vary in all 3 at once • Bars can compare to 2D counterparts • Bars made with salient edges and spheres with some texture to ensure perception of 3D shape Fig 2
Methods Jansen et al., slides from this paper
Methods Told that throughout they are to judge the relative difference between two shapes Remains in the visual domain but requires Requires conversion from visual domain conversion from one type of shape to into numeric domain another
Experiment Design Fig 7
Experiment Design Fig 6
Results Fig 8
Results bars spheres estimated percentage height ratio (in %) diameter ratio (in %) Fig 4 & Jansen et al., slides from this paper
Accuracy Fig 11 Jansen et al., slides from this paper
Accuracy Jansen et al., slides from this paper
Discussion • Chose bars and spheres as representative of marks that vary in only one dim vs. all 3 at once — next need to test if these 2 are indeed representative • Recent work on haptic perception of cubes, spheres, pyramids, also show surface area as best predictor • 2 methods had significantly different results — CS method of interest as it is purely visual method whereas RE method is a cross-modality matching task — in future work with CS recommend verifying all participants have adopted same mental model of the task Kahrimanovic et al., Haptic perception of volume and surface area of 3-D objects , 2010
Discussion • If can identify physical marks (or graphical marks) within acceptable error margins but for which participants feel little confidence in their estimates, such marks could encode uncertainty or “sketchiness” Boukhelifa et al., Evaluating Sketchiness as a Visual Variable for the Depiction of Qualitative Uncertainty , 2012
Conclusion Primary contribution is a series of analysis steps to determine suitability of a physical variable to encode data: 1. Fit models 2. Assess variability between subjects 3. Assess accuracy and estimation biases (overestimations and underestimations) 4. Determine scaling if necessary Repeat for all object measures that exist to describe a physical variable being tested for possible predictors for perception of the variable
Other Challenges VISUAL perception of physical marks only — argument that active touch is important but first need to collect empirical data on visual perception of physical marks Microsoft Hololens, Case Western Reserve collaboration, 2015
Other Challenges • Other important haptic variables like friction and temperature, but what about all 5 senses? • What about interactions between the senses? We already know that some visual variables interact with one another in advantageous and disadvantageous ways… Probably true of physical variables AND sensory modality… Hamburg, Whitebook, annual report for Arctic Paper , 2012 Realitat, Microsonic Landscapes , 2012
Other Challenges • separating senses could be misleading, for example: flavor — many seemingly disparate cues from each of the senses integrates into the single percept • defining “physical variable” becomes very important (smoothness, hardness, sponginess) — do we even have enough language for this? Janine Antoni, Lick and Lather , 1993
Other Challenges • Perceived actively through exploratory actions involving the body so do you also have to develop “corporeal variables”? Hsiang and Mendis, City of 7 Billion , 2015
Other Challenges Some of the greatest benefits of data physicalizations may be very hard to measure quantitatively: • exploratory interactions where no clear task is defined • pedagogical and persuasive power • insights gained through interaction • extent to which they promote engagement and behavior change • memorability • affective responses • understanding how people reason, collaborate and communicate with them (Jansen, et al. Opportunities and Challenges for Data Physicalization , 2015) Expedition Zukunft , 2009 Nobel Museum Exhibition , 2016
Recommend
More recommend