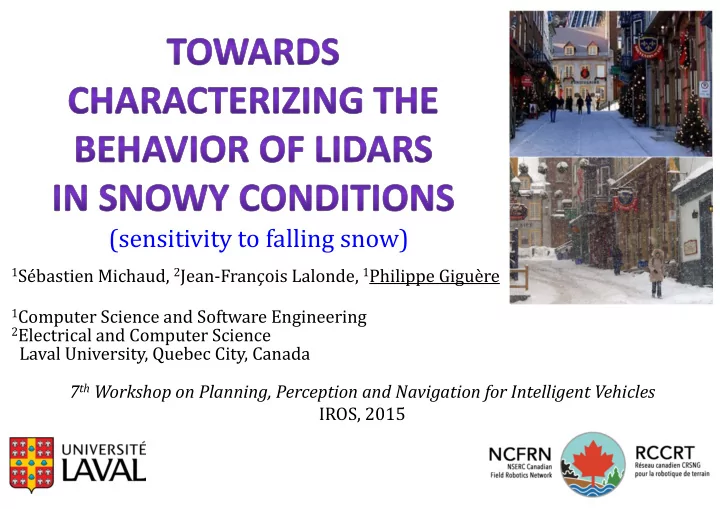

(sensitivity to falling snow) 1 Sébastien Michaud, 2 Jean‐François Lalonde, 1 Philippe Giguère 1 Computer Science and Software Engineering 2 Electrical and Computer Science Laval University, Quebec City, Canada 7 th Workshop on Planning, Perception and Navigation for Intelligent Vehicles IROS, 2015
Motivation and context Atlanta, 2014 6 cm snow Rolling Dead scenario when snow is falling? Walking Dead 2/16
Outline • List of LiDARs + description • Physical test bench for data collection • Analysis of snowflake echoes in LiDARs: – Temporal variation during snowstorms – Probabilistic sensor modeling as function of range (for Bayesian perception) • Discussion and conclusion 3/16
Description of LiDARs Sensor Maximum Spot Area at Spot Shape Number distance ( m ) 30 m ( cm ²) of echos SICK LMS200 28 165 Circle 1 SICK LMS151 50 22 Circle 2* Hokuyo UTM‐30LX‐EW 30 196 Ellipse 3 Velodyne HDL‐32E 70 51 Rectangle 1 *was programmed to return last echo Velodyne on loan from UTM‐30LX‐EW was on Canadian Space Agency loan from Hokuyo 4/16
Physical setup : 4 sensors in a row • Provide some shielding to avoid sensor clogging • Fast to deploy (just open the window!) • Simultaneous data collection • Could be left open for long periods of time 5/16
View of the “target” • Target away from pedestrians and trees pedestrian walkway Approximate Lidar Impact location range between 14 m to 22 m 6/16
Variety of snowfall episodes gathered • Total: 50 hours of recording (>300 Gb) • The ones in bold were used in the study • rosbag s available upon demand 7
Sensor data gathering settings (away from walkways) 8/16
Snowflake detection + temporal smoothing • Threshold for echo: 14 m thresh. for echoes • To simplify viewing, Repetitions used averaging windows unlikely (remove very short term dynamics) thresh. for echoes Clusters of echoes for Hokuyo 9
Snowstorm temporal evolution (1) Hokuyo 1 st echo (1x) Similar behavior SICK LMS200 (1x) Hokuyo last echo (30x) Similar Veolodyne (30x) LMS151 (200x) behavior Note: (‐‐x) is scaling factor 10/16
Snowstorm temporal evolution (2) Numerous fluctuations during a storm Average over this event 11/16
Snowstorm temporal evolution (3) Peak avg 0.5% Velodyne ~2cm/h snow Snowstorms have different • temporal evolutions Often have sharp peaks • 12/16
Probabilistic model of echoes P ( Echo | x ) Shielding would be model much less on a vehicle Overall % • Distributions normalized with area = 1 of echoes 13
Physical interpretation 1 • Large targets: return is ~ 2 d (most of the beam paints target) 1 • Snowflakes: return is ~ 4 d (fraction of beam intercepted is 1/d²) Sensor Spot Area at 30 m ( cm ²) SICK LMS200 165 SICK LMS151 22 Hokuyo UTM‐30LX‐EW 196 Velodyne HDL‐32E 51 14/16
Conclusion • Snowstorms are highly dynamic • Most recent LiDARs have very low probability of snow interference (<0.1%) • Multi‐echoes can be used to detect snowing conditions • Distribution follows more‐or‐less a log‐normal as function of range: easy to put in a simulator • Snowflakes are virtually undetectable beyond 10 m (should be able to still use building walls for localization) 15/16
Future work • % of missing echoes • Impact of sunlight • Noise on target • Intensity of echoes in snowflakes as function of distance • Collect data in a more car‐like setup 16/16
Recommend
More recommend