Segmentation Faults Otherwise known as segfaults. Occur when you - PowerPoint PPT Presentation
Segmentation Faults Otherwise known as segfaults. Occur when you try to access memory that you don't have permission to. Results in one of the least-informative error messages when using gcc. It is often more useful to be told the
Segmentation Faults � Otherwise known as segfaults. � Occur when you try to access memory that you don't have permission to. � Results in one of the least-informative error messages when using gcc. � It is often more useful to be told the line on which the segfault occurs. � GDB is a tool which you can use to debug C code, which tells you what line the segfault occurred on.
GDB � GDB allows you to do many things: � Pause your code at any time. � Print the contents of any existing variables at that point in the code. � Step through your code executing each line individually before pausing again. � Find out what line of your code caused that annoying segmentation fault. (Note: the line that caused the segmentation fault, is often not the line which has the error).
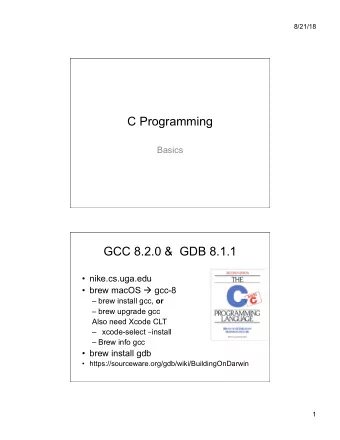
Using GDB 1.Compile using the -g flag: • % gcc -Wall -Werror -g -o binaryFile myFile.c 2.Start gdb: • % gdb binaryFile 3.To run your program: • (gdb) run 4.To quit: • (gdb) quit • Note the change in prompt symbol when gdb is running.
GDB Useful Commands � To stop a program during execution: � Break <line number or function name> � To view contents of variables at current point: � Print <variable name> � To keep going: � Continue n � Step n - goes into functions � Next n - steps over functions � To view the stack (useful at seg faults) � Where
Other Useful Commands � To see the code around the line you're currently at: � List
GDB Examples � llsegfault.c � cause: derefrencing null pointer � segfault line num � print i curr � stackoverflow.c � cause: running out of memory by recursive non- ending function calls � where � backtraceExample.c � where
DDD - graphical GDB � DDD has the same commands as gdb, but is graphical. � One of the main advantages of this is the ability to visually represent data structures.
Viewing Data Structures with DDD � Compile with -g flag. � Run ddd: � % ddd binaryFile � Set a breakpoint at the point that you want to view the data structure: � break <line number> OR � drag the breakpoint image onto the line you want to break at � Run the program: � (gdb) run
Viewing Data Structures with DDD (cntd) � When the breakpoint is reached: � If you can't see the place where data structures would be drawn, select View->Data Window. � Right click in the data window and select 'New Display'. � Enter the variable name that you want to draw a picture of and press enter. � Wherever you see ... it means you can expand the data structure. Do this by double clicking on the ... .
DDD Examples � aircraft.c (Lab 6)
Segfaults: a deeper view � Another handy tool is: Electric Fence. � First, some background as to why it is handy.
SegFaults (ctnd) � Ask for a piece of memory of the right size: � malloc(sizeof(int));
SegFaults (ctnd) � The memory is allocated.
SegFaults (ctnd) � When only a small piece of memory is required, instead of providing only that small piece, the operating system gives the user access to a whole page of memory. � Further mallocs will return other sections of this same page.
SegFaults (ctnd) � A segfault occurs when the user tries to access the red section of memory. � Eg, if you malloc an array, and go 1 or 2 indexes off the end, you may never get a segfault.
SegFaults (ctnd) � But you don't know that it will never segfault.
Electric Fence � If you try to access memory that's on the same page in memory, as something you've malloced, then no segfault will occur. � But, if you've accessed memory that you haven't malloced, you want to know sooner rather than later (when it wreaks havoc on your program). � Electric Fence is a program which causes segfaults to happen whenever you access memory in the heap that you haven't malloced.
Using Electric Fence � Compile with -g and -lefence flags: � % gcc -lefence -g -o binaryFile myFile.c � Run the program within gdb: � % gdb binaryFile � (gdb) run
Valgrind � When you want to check if you've freed everything you've malloced. � Using Valgrind: � Compile your program with -g flag. � Pass your file into valgrind: � % valgrind --leak-check=full ./binaryFile � The output will summerise any memory leaks and violations. This includes memory blocks that have been malloced, but not freed. � The flag --leak-check=full means that it tells you where you malloced something that you forgot to free.
Valgrind Demos � valgrindDemo.c
Recommend
More recommend
Explore More Topics
Stay informed with curated content and fresh updates.
