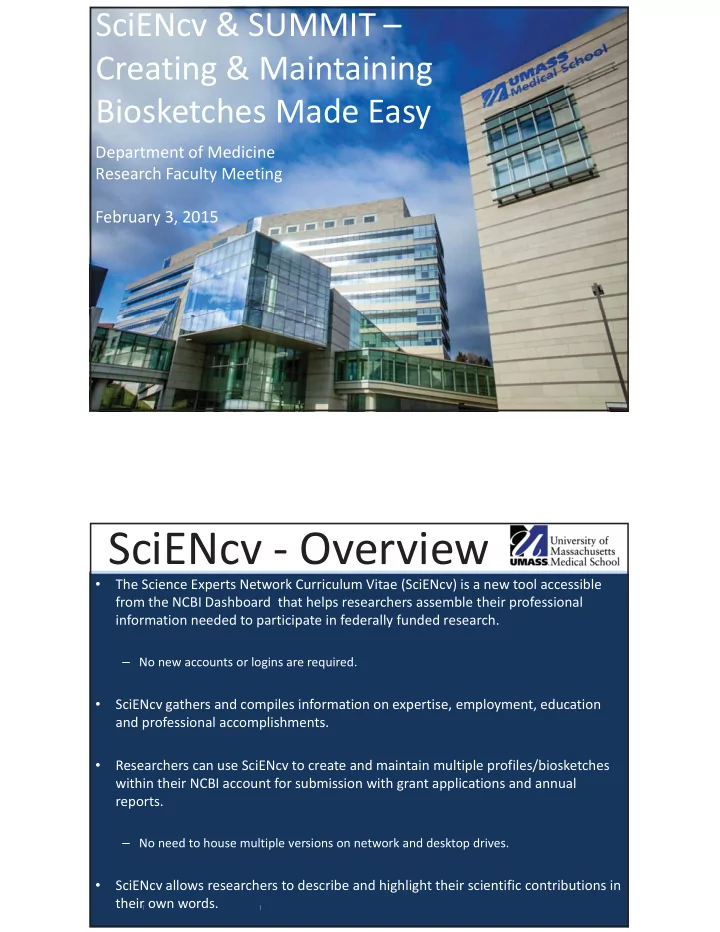
SciENcv � & � SUMMIT � – Creating � & � Maintaining � Biosketches � Made � Easy Department � of � Medicine Research � Faculty � Meeting February � 3, � 2015 SciENcv �� Overview • The � Science � Experts � Network � Curriculum � Vitae � (SciENcv) � is � a � new � tool � accessible � from � the � NCBI � Dashboard �� that � helps � researchers � assemble � their � professional � information � needed � to � participate � in � federally � funded � research. – No � new � accounts � or � logins � are � required. • SciENcv � gathers � and � compiles � information � on � expertise, � employment, � education � and � professional � accomplishments. � Researchers � can � use � SciENcv � to � create � and � maintain � multiple � profiles/biosketches � • within � their � NCBI � account � for � submission � with � grant � applications � and � annual � reports. – No � need � to � house � multiple � versions � on � network � and � desktop � drives. SciENcv � allows � researchers � to � describe � and � highlight � their � scientific � contributions � in � • their � own � words. | |
SciENcv �� Benefits • Eliminates � the � need � to � repeatedly � enter � biosketch � information. • Reduces � the � administrative � burden � associated � with � federal � grant � submissions. • Allow � researchers � to � describe � their � scientific � contributions � in � their � own � language. • Allows � researchers � to � delegate � access � to � administrators � so � they � can � update � biosketches � for � the � researchers. | | SciENcv � & � eRA � Commons • eRA � Commons � account � holders � who � have � linked � their � accounts � to � NCBI � can � populate � their � SciENcv � profiles � with � information � stored � in � their � eRA � Commons � account. • The � information � transferred � to � SciENcv � can � be � edited, � hidden, � augmented � or � deleted. � • SciENcv � users � control � the � content � displayed � in � their � SciENcv � profiles � even � when � it � is � imported � from � other � sources. | |
Setting � up � SciENcv �� Recommendations • Link � your � eRA � Commons � account � to � NCBI. – This � will � populate � SciENcv � with � data � from � your � Commons � profile. • Create � an � ORCID � (Open � Researcher � and � Contributor � ID) � and � link � to � NCBI. – The � ORCID � is � a � nonproprietary � alphanumeric � code � that � uniquely � identifies � scientific/academic � authors � and � will � allow � you � to � associate � non � NCBI � publications with � your � SciENcv � account. – Visit � http://orcid.org/ � to � register � for � an � ORCID, � or � contact � the � Library � (Rebecca � Reznik � Zellen) � for � assistance. – The � Library � will � provide � guidance � on � how � to � populate � your � SciENcv � using � ORCID � with � Scopus � bibliographic � data. • Use � the � UMMS � SUMMIT � Biosketch � Dashboard � to � get � non � eRA � Commons � award � information � for � ongoing � and � completed � research � projects. | | Accessing � SciENcv � via � NCBI • Go � to: � https://www.ncbi.nlm.nih.gov/ • Click � on � Sign � in � to � NCBI � link � in � right � hand � corner 1 • The � following � box � will � appear • Select � “Sign � in � with � eRA � Commons” 2 • This � will � take � you � in � to � the � login � screen � below • Login � with � your � eRA � Commons �� credentials 3 | |
Using � the � SUMMIT Biosketch �� Dashboard • UMMS’s � reporting � tool � allows � researchers � and � staff � to � access � non � eRA � Commons � award � information � to � populate � research � support � section � of � the � biosketch. • The � job � aid � on � how � to � use � the � access � and � use � the � dashboard � is � being � shared � as � a � handout � today. | | Questions? Please � contact: Rebecca � Reznik � Zellen Head � of � Research � & � Scholarly � Communication � Services Lamar � Soutter � Library Phone: � 508.856.6810 email: � rebecca.reznik � zellen@umassmed.edu Diego � R. � Vazquez Assistant � Vice � Provost Research � Funding � Services Phone: � 508.856.5600 email: � diego.vazquez@umassmed.edu
SUMMIT Biographical Sketch Dashboard University of Massachusetts Medical School Worcester Campus Job Aid (Jan 2015)
SUMMIT BioSketch Dashboard Table of Contents Summit Overview ..................................................................................................................................................... 3 What is Summit? What are Dashboards? What are Widgets? Logging into Summit General Navigation ..................................................................................................................................................... 4 Prompts/Filters ........................................................................................................................................................... 5 Biographical Sketch Reports Descriptions .................................................................................................................. 7 2
SUMMIT BioSketch Dashboard Summit Overview Job Aid What is The UMass SUMMIT Program is a partnership with the business community to coordinate Summit? and manage the Enterprise Reporting efforts at the University. SUMMIT is a business intelligence and report inquiry tool that transforms volumes of data into valuable, actionable information. Summit incorporates leading practices and tools widely accepted in the industry for the summarization and presentation of data. What are Dashboards are intended to provide decision-makers with an understanding of relevant data Dashboards? in support of the business operations. It tracks key performance indicators and provides warnings, action alerts and next steps when areas of the business fail to meet pre- determined metrics. An effective Dashboard is integrated with visual analytics to provide a single tool for rapid, insightful decision making. What are Widgets are presentations of data within a Dashboard. Data within a widget may be Widgets? presented as an alert, in graphical and/or table format. Widgets can be customized based upon the business question it is intended to answer. Widgets can present data in multiple views i.e. pie graph, bar graph or line graph. Logging into 1. Navigate to the intranet (http://inside.umassmed.edu). 2. Click Financial Services then click Summit from the left navigation bar. Summit 3. Click SUMMIT Sign on to access the login screen. 4. Enter your School Network User ID, Password & Campus 5. Click the Login button. Internet Settings are required for your desktop to work properly with Summit. The document: “Internet Browser Settings” is found on the school website, under Financial Services/Systems Support webpage and should be set-up prior to accessing Summit: http://inside.umassmed.edu/financialservices/systemssupport/index.aspx 3
SUMMIT BioSketch Dashboard General Navigation Upon Logging into Summit, the following Home Page view displays. Available Dashboards can be accessed via the Dashboard Drop Down Menu Option at the top of the Home Page. Click on FDM:BioSketch to access the BioSketch Dashboard. NOTE: There is also a link to the BioSketch Dashboard within the REPORTS section of both the Academic Admin Worcester Dashboard and the PI Worcester Dashboard. 4
SUMMIT BioSketch Dashboard Prompts/Filters A Prompt/Filter Box is located on the left hand side of the BioSketch Dashboard. To retrieve information you must first enter in an investigator. Choose the arrow to the right of “Select an Investigator” a drop down list will appear; All Users have access to all Investigators. To narrow your search click the More/Search option at the bottom of the box. 5
SUMMIT BioSketch Dashboard A Select Values box will open. Type in all or a portion of the Investigator’s name and the options will display. Click on the name of the appropriate Investigator and click the right arrow to move the Investigator’s name to the right hand side. Then choose OK. The data on the Right Side of the Dashboard will return information for the selected Investigator. You can also choose the date range for the Investigator’s Completed Research. Do this by choosing an Award End Date to go back through using the Award End Date Filter. By default this date will display three years from the current date. Note : Every time you change your date criteria, you must click Apply . 6
Recommend
More recommend
Unleash a World of Digital Possibilities—Browse, Share, and Explore Content Without Boundaries