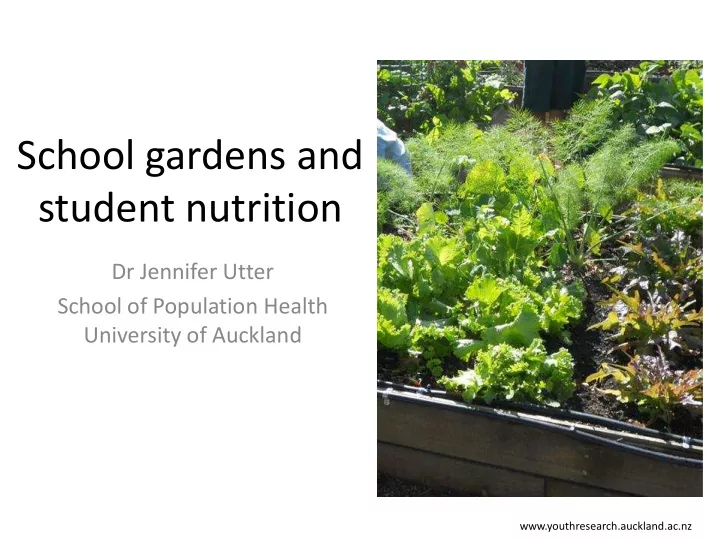

School gardens and student nutrition Dr Jennifer Utter School of Population Health University of Auckland www.youthresearch.auckland.ac.nz
Background www.youthresearch.auckland.ac.nz
Challenges with evaluation • Time and resource required to set up • Design, comparison groups • Selection bias • Implementation www.youthresearch.auckland.ac.nz
www.youthresearch.auckland.ac.nz
www.youthresearch.auckland.ac.nz
www.youthresearch.auckland.ac.nz
Aims • Describe the prevalence and characteristics of secondary schools with school gardens • Determine the relationship between presence of a school garden and student eating behaviours and BMI www.youthresearch.auckland.ac.nz
Youth’12 Student data • Fruit and vegetable consumption • Fast food/ takeaway consumption • Physical activity • Measured height/ weight www.youthresearch.auckland.ac.nz
Youth’12 School level items • “Does your school have a garden (vegetable and/ or fruit) that students participate in?” • School funding • Co-educational/ single sex • School size • School decile www.youthresearch.auckland.ac.nz
Analysis • Multilevel regression models used to estimate the association between presence of school garden and student nutrition indicators • Analyses control for student characteristics (sex, age, ethnicity, socioeconomics) and school characteristics (size, funding, decile) www.youthresearch.auckland.ac.nz
Fruit/ vegetable garden at school Yes (n=42) 45% 55% No www.youthresearch.auckland.ac.nz
School gardens by school funding 59% 43% 40% Private (n=2) Integrated (n=6) Public (n=34) www.youthresearch.auckland.ac.nz
School gardens by school size 56% 56% 50% Small, <300 students (n=8) Medium, 301-700 students Large, >700 students (n=19) (n=15) www.youthresearch.auckland.ac.nz
School gardens by decile 63% 52% 50% Deciles 1-3 (n=11) Deciles 4-7 (n=16) Deciles 8-10 (n=15) www.youthresearch.auckland.ac.nz
School gardens and F&V consumption School garden No garden 60% 50% 40% 30% 20% 10% 0% Fruit, 2+ a day Vegetables, 3+ a day www.youthresearch.auckland.ac.nz
School gardens and fast food/ takeaway consumption Fast food School Garden P=0.042 www.youthresearch.auckland.ac.nz
School gardens and BMI BMI School Garden P=0.013 www.youthresearch.auckland.ac.nz
School gardens, BMI and poverty School garden No garden 26.0 25.5 25.0 24.5 24.5 24.0 23.7 23.4 23.5 23.2 23.0 22.5 22.0 No poverty Household poverty P=0.04 www.youthresearch.auckland.ac.nz
Summary • School gardens common among secondary schools • Appear to be associated with better nutrition indicators, particularly for young people living with poverty • Implementation of school gardens and integration within community largely unknown www.youthresearch.auckland.ac.nz
Recommend
More recommend