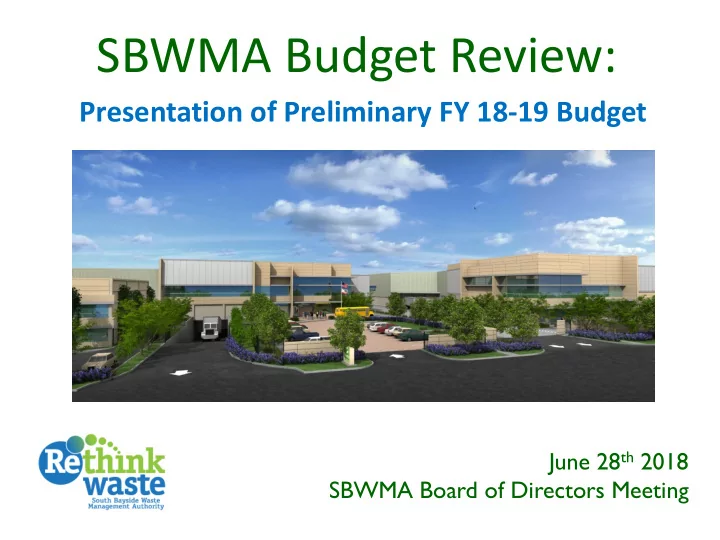

SBWMA Budget Review: Presentation of Preliminary FY 18-19 Budget June 28 th 2018 SBWMA Board of Directors Meeting
Additional Tip Fee Increase FY 18/19 - Financial Impact of Raising Franchised Tip Fees an additional $2/Ton Increase FY18/19 Franchise Variance to $2 Preliminary Tip Fee Preliminary Categories Budget $2/Ton Budget Variance % Increase Tip Fee Revenue $47,324,987 $47,641,273 $316,286 0.67% Franchise Fee 2,253,616 2,268,677 15,062 0.67% Net Budget Increase/(Decrease) $301,224 $632,572 CY 2019 Annualized Revenue Increase Rate Payer % Increase/(Decrease) 0.63% FY 18/19 - Financial Impact of Raising Franchised Tip Fees an additional $6/Ton Increase FY18/19 Franchise Variance to Preliminary Tip Fee Preliminary $6 Categories Budget $6/Ton Budget Variance % Tip Fee Revenue Increase $47,324,987 $48,273,845 $948,858 2.00% Franchise Fee 2,253,616 2,298,800 45,185 2.00% Net Budget Increase/(Decrease) $903,673 CY 2019 Annualized Revenue Increase $1,897,716 Rate Payer % Increase/(Decrease) 1.90%
Tip Fee Increase Schedule TIP FEE HISTORY Actual Actual Actual Actual Estimate Estimate Jan '16 Sep '16 Jan '17 Jan '18 Jul '18 Jan '19 TS Tip Fee SBWMA Solid Waste $94 $94 $104 $107 $107 $121 SBWMA Green Waste $96 $96 $106 $112 $112 $126 SBWMA Food Waste $107 $107 $118 $121 $131 $141 SBWMA C&D $94 $94 $104 $107 $107 $121 Non-SBWMA Solid Waste $97 $105 $110 $113 $113 $127 Non-SBWMA Green Waste $99 $101 $106 $115 $115 $128 Non-SBWMA Food Waste $107 $112 $118 $121 $131 $141 Non-SBWMA C&D $81 $97 $104 $107 $107 $120 Public Weighted Dirt (Tons) $88 $88 $95 $98 $98 $103 Public Solid Waste (Yards) $38 $38 $41 $42 $42 $44 Public Green Waste (Yards) $27 $27 $29 $31 $33 $35 Public C&D (Yards) $35 $35 $38 $40 $42 $44
Organics to Energy Pilot ORGANICS TO ENERGY PILOT COST DETAIL Estimated System Cost $ 5,000,000 CalRecycle - Repurpose SF Recology Press $ (1,800,000) CalRecycle - Equipment Grants $ (1,200,000) Potential Other Grants $ (1,000,000) Net Cost before Contingency $ 1,000,000 Add: Contingency - 25% $ 1,250,000 Total Estimated Cost $ 2,250,000
Public Tip Fee Survey SHOREWAY Material Type Current (Jan 2018) Proposed 7/1/18 Proposed 1/1/19 Solid Waste $42 cyd $42 cyd $44 cyd C&D $40 cyd $42 cyd $44 cyd Yard Waste $31 cyd $33 cyd $35 cyd Food Waste $121 ton $131 ton $141 ton Dirt $98 ton $98 ton $103 ton NEIGHBORING FACILITIES (as of April 2018) Material Type Zanker Ox Mtn SMART (cyd) Newby Island BlueLine TS Solid Waste $30 cyd $36 cyd $20 cyd $51 cyd $103 ton (25.75 cyd) C&D $30 cyd $34 cyd $39 cyd $47 cyd $115 ton (23.00 cyd) Yard Waste $30 cyd $32 cyd $20 cyd $47 cyd $95 ton (23.75 cyd) Food Waste n/a $77 ton MSW Dirt $50 cyd $35 cyd $75 cyd $46 cyd 80 ton
Rate Payer Impact Preliminary FY 18-19 Budget ($14 Tip Fee Inc) TRANSFER STATION REVENUE Impact to Franchise Rate Payer of Tip Fee increase Calendar Year 2019 Revenue Rate Increase Impact 2019 Estimated Volume Q1, 2 Q3, 4 TOTAL SBWMA Solid Waste 90,672 90,672 181,345 $ 14.00 $ 2,538,828 SBWMA Green Waste 44,288 44,288 88,575 $ 14.00 $ 1,240,050 SBWMA Food Waste 13,339 13,339 26,678 $ 20.00 $ 533,554 SBWMA C&D 56 56 112 $ 14.00 $ 1,565 SBWMA Dirt, Inert 1,066 1,066 2,132 $ 14.00 $ 29,843 SBWMA Wood 216 216 432 $ 14.00 $ 6,050 SBWMA Other, BI 455 455 911 $ 14.16 $ 12,898 TOTAL 150,092 150,092 300,184 $ 4,362,789 Total Rate Payer Revenue $ 99,556,028 Tip Fee Increase Impact to Rate Payer % 4.4%
Financial Summary Table 2 FY18/19 FINANCIAL SUMMARY FY17/18 FY17/18 FY18/19 Variance to Adopted Mid-Year Preliminary Adopted Better/Worse Categories Budget Budget Budget Budget % $46,960,353 $49,180,563 $51,694,167 Total Revenue $4,733,815 10% $3,653,015 $3,688,963 $3,375,780 Program ($277,235) 8% Shoreway Operations $ 35,927,570 $ 39,146,496 $ 41,110,633 $5,183,063 -14% 39,580,585 42,835,459 44,486,413 Total Operating Expense $4,905,828 -12% Non-Operating Expense 4,556,880 4,734,406 4,894,949 338,069 -7% 44,137,465 47,569,865 49,381,362 5,243,898 Total Expense -12% Net Income $ 2,822,888 $ 1,610,698 $ 2,312,805 $ (510,083) -18%
Projected Reserves Balances Table 11. SBWMA RESERVES FY18/19 BUDGET: RESERVE BALANCES ADOPTED MID-YEAR PRELIMINARY FY19 vs. FY18 ACTUAL BUDGET BUDGET BUDGET Mid-Year Budget FY16/17 FY17/18 FY17/18 FY18/19 UNCOMMITTED RESERVE: RATE STABILIZATON (10% of expense) $ 4,033,671 $ 4,237,586 $ 4,756,987 $ 4,938,136 $ 181,150 EMERGENCY RESERVE (10% of expense) 4,033,671 4,237,586 4,756,987 4,895,300 138,314 CAPITAL RESERVE (Undesignated) 6,828,704 4,438,135 3,437,843 957,415 (2,480,428) TOTAL UNCOMMITTED RESERVES $ 14,896,047 $ 12,913,307 $ 12,951,816 $ 10,790,851 $ (2,160,965) COMMITTED RESERVE $ 14,675,560 EQUIPMENT REPLACEMENT (ANNUAL) $ 1,192,148 $ 1,723,744 $ 1,723,744 $ 1,397,514 $ (326,231) TOTAL RESERVES $ 16,088,195 $ 14,637,052 $ 14,675,560 $ 12,188,365 $ (2,487,195) proof $ 16,088,195 $ 13,167,371 (1,412,635) $ - SHOREWAY REMEDIATION PROJECT $ 1,233,640 $ 1,233,640 $ 1,233,640 $ 1,233,640 $ -
Recommend
More recommend