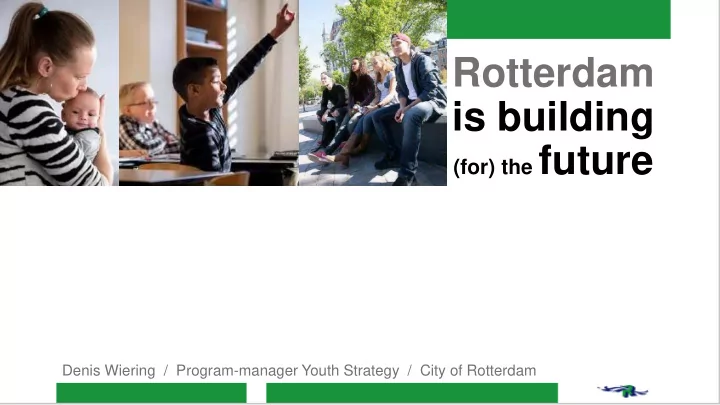

Rotterdam is building (for) the future Denis Wiering / Program-manager Youth Strategy / City of Rotterdam
In this presentation : • Rotterdam: before and after • Changes and challenges • From objectives to factors • Interaction and evidence • Ranking the factors • Sneak preview on data science • Some showcases • Results and things ahead
Rotterdam ‘80
Rotterdam now
3,8% vs 2,1% 623.652 Rotterdam now 207.098 1.350 17% 17.500 18% vs 15% 1/4 9%
Rotterdam objectives
Rotterdam f1
Rotterdam now
Rotterdam now
Rotterdam is growing Policy model Through Input Impact Outcome Output put Benefits from activities and time / money / Activities / interventions interventions quality Monitoring and learning
Ranking the factors On relevance, on impact, on prevalence Factor ranking Social and emotional competences 1 Parental psychopathology 2 Social economic situation / debts / poverty 2 Parental skills 2 Psycho social problems 3 Truancy / school drop out / poor performances 3 Housing / deprived environment 3 Substance abuse 4 Domestic violence 4 Criminality 5 Sport and activity 5 Culture and leisure 5 Temperament 5 Acces to services 5 Nutricion 5
Smart cluster approach: ecosystems Macro level legislation public policies economy value systems Meso level neighborhood school work Micro level family network person Impact
Possibilities of data science
Some showcases • Social emotional health: from 0.3M to 2.2M of evidence or theory based interventions • For example: Good Behaviour Game / decrease on agression, depression, anxiety, adhd • Dynamic Cost Benefit Analysis of effective prevention: savings on child protection costs • Monitoring and learning cycles with practitioners in preventive youth domain • Method of distric programming of activities ‘ Prosperous Neighbourhoods ’, inspired by American Communities that Care programme: prevevntion, educational programmes, sports, culture etc. • Drugs & Alcohol programme: projects in sports, leisure, nightlife, schools
Results: some stats • Decrease in substance abuse: • Alcohol life time use among 14/15 year olds: from 45% in 2010 to 31.5% in 2017 • Alcohol binge drinking among 14/15 year olds: from 18% in 2010 to 7.1% in 2017 • Canabis life time use among 14/15 year olds: from 11% in 2010 to 4.6% in 2017 • Decrease in school drop outs: from 5,3% in 2011/2012 to 3% in 2016/2017 • Decrease in criminality: from 9.360 crimes commited by young people per year in 2010 to 3.418 per year in 2017 • Increase in school performance: average Dutch National Final Test score from 531,2 in 2010 to 534,2 in 2017 • Increase in birth outcomes: 11,5 per 1,000 births (2000-2008) to 7,6 per 1,000 births (2011-2016)
Things ahead • Smart cluster approach in order to tackle the complex ecosystem of poverty • Social emotional health: flip the perspective, insight in protective factors • Criminality: what’s behind the stats? • Equal opportunities: closing the gap • Every day focus in building (for) the future: more young people growing up healthier, safer and with more chances in life
Recommend
More recommend