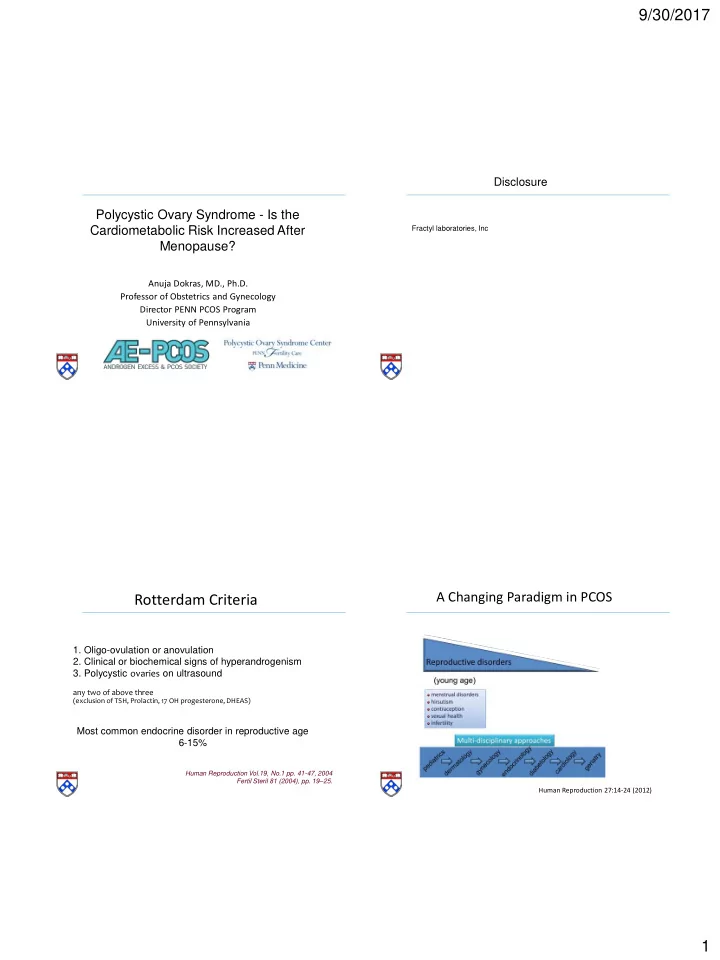

9/30/2017 Disclosure Polycystic Ovary Syndrome - Is the Cardiometabolic Risk Increased After Fractyl laboratories, Inc Menopause? Anuja Dokras, MD., Ph.D. Professor of Obstetrics and Gynecology Director PENN PCOS Program University of Pennsylvania A Changing Paradigm in PCOS Rotterdam Criteria 1. Oligo-ovulation or anovulation 2. Clinical or biochemical signs of hyperandrogenism 3. Polycystic ovaries on ultrasound any two of above three (exclusion of TSH, Prolactin, 17 OH progesterone, DHEAS) Most common endocrine disorder in reproductive age 6-15% Human Reproduction Vol.19, No.1 pp. 41-47, 2004 Fertil Steril 81 (2004), pp. 19 – 25. Human Reproduction 27:14-24 (2012) 1
9/30/2017 PCOS in the Perimenopause PCOS n=681, controls n=230 % women with ovulatory cycles increased from 52 to 85% Age in years Carmina et al, 2012, Obstetrics and Gynecology Pinola et al, JCEM , 2015 Hirsuitism Infertility Oligomenorrhea 619 4337 PCOS Endometrial hyperplasia OBESITY Preeclampsia Wiser et al, RBO , 2013 Glucose intolerance Hyperlipidemia Cardiovascular disease risk 2
9/30/2017 Obesity in PCOS Adolescents Obesity in PCOS OR 2.77 (95%CI 1.88-4.1) Lin et al, HRU, 2012 Hickey et al, 2011, Hum Reprod Abdominal Adiposity in PCOS Obesity Not Part of the Diagnosis of PCOS Prevalence of abdominal adiposity in normal and overweight women Yildiz et al, JCEM, 2008 Teede et al, Obesity, 2013 Jovanovic et al. Fert Steril 2010 Aug 3
9/30/2017 Risk of Gestational Diabetes PCOS – Impaired Glucose Tolerance OR 2.48 (1.63-3.77) Prevalence 6-35% Moran et al, 2010, Hum Reprod Qin et al, 2013 OR 3.58 (95% CI 3.05 - 4.20) Diabetes Risk Independent of Age and BMI PCOS - Type 2 Diabetes HR 3.07 (95% CI 2.7-3.3) OR 4.43 (4.06-4.82) Prevalence 2-10% Morgan et al, 2012, JCEM Moran et al, 2010, Hum Reprod 4
9/30/2017 Dyslipidemia - HDL-C Dyslipidemia - Triglycerides Mean difference 26.6mg/dl (95%CI 19.9-38.1) HDL-C is lower in PCOS by 6.41mg/dl (95%CI 3.48-9.14) Only 3 studies were TG >150mg/dl Cholesterol Efflux Capacity & Coronary Artery Disease Reverse Cholesterol Transport & Efflux Khera et al, NEJM, 2013 5
9/30/2017 Cholesterol Efflux Capacity and Incident Heart , According to Models Based on High-Density Lipoprotein Disease – Dallas Heart Study (HDL) Cholesterol Level and Cholesterol Efflux Capacity. Roe et al, 2014, JCEM Women with PCOS had an 11% decrease in Rohatgi A et al. N Engl J Med 2014;371:2383-2393. normalized cholesterol efflux capacity Lipid Profile Overview Dyslipidemia - LDL-C LDL-C levels were higher by 12.6mg/dl (%95 CI 9.5-16.5) 6
9/30/2017 Risk of Metabolic Syndrome Lipoprotein Subclass Particles - NMR Spectroscopy OR 2.88 (95% CI 2.4-3.45) Roe et al, 2014, JCEM **p<0.01, *p<0.05 Moran et al, 2010, Hum Reprod Androgen Levels and Cardiometabolic Risk Factors Metabolic Syndrome in PCOS phenotypes PCOS n=170 Normal n=170 Fauser et al, Hum Reprod 2015 7
9/30/2017 Is PCOS a Lifetime Metabolic Disorder? Impact of Race on Metabolic Risk * US US PCOS White Black India Brazil Finland Norway n 186 101 220 238 94 287 * * Metabolic 52 52 65 70 26 106 * Syndrome (28%) (51.5%) (29.6%) (29.4%) (27.7%) (26.5%) * * BMI 89 74 82 100 45 135 * * criterion (47.9%) (73.3%) (37.3%) (42%) (47.9%) (47%) TG 38 10 59 64 11 58 criterion (20.4%) (9.9%) (26.8%) (26.9%) (11.7%) (20.2%) BP 68 59 37 83 34 131 * criterion (36.6%) (58.4%) (16.8%) (34.9%) (36.2%) (45.6%) * Glucose 22 22 63 42 75 * criterion (11.8%) (21.8%) (28.6%) (17.7%) 16 (17%) (26.1%) HDL 77 72 214 142 41 161 criterion (41.4%) (71.3%) (97.3%) (59.7%) (43.6%) (56.1%) Chan et al, AJOG, 2017 Human Reprod 2012 Sprung et al, Clin Endo 2013 8
9/30/2017 Coronary Artery Calcification (CAC) & PCOS Does the CVD Risk Persist in the Menopause? Study Author Outcome Measure/ n Population/ Year Results Study Design Obese, Shroff, 24 cases Prevalence of CAC (>0) 2007 24 24 premenopausal OR=5.5 (1.03, 29.45) controls [cross-sectional] p<0.03 Christian, 2003 36 cases Premenopausal, Prevalence of CAC (>0) 71 controls age 30-45 OR=1.99 (0.68,5.82) [cross-sectional] p=0.21 (NS) Talbott, 61 cases BMI < 35 Prevalence of CAC (>0) 2004 85 controls [prospective] OR=2.31 (1.00, 5.33) Age 40-61 p=0.049 Talbott, 149 cases All BMI Prevalence of CAC >10 2008 166 controls [cross-sectional] OR=1.90 (1.04, 3.48) p=0.037 Chang, 2011 144 PCOS Age 37-45years Prevalence of CAC 170 controls Cross sectional (>10) PCOS 5.4% controls 6.3% p=0.74 Calderon-Margalit 55 PCOS Mean age 45.3 Prevalence of CAC (>0) 2014 668 controls OR 2.7 (1.37-5.25) 33 Change in Metabolic Risk over 20 years Coronary Artery Disease Timeline Hypertension Diabetes A, Diabetes prevalence in 2008 and 1987; B, prevalence of treated hypertension in 2008 and 1987. *, P < 0.05; **, P < 0.01; ***, P < 0.001. Schmidt J et al. JCEM 2011;96:3794-3803 9
9/30/2017 Perimenopause and Metabolic Syndrome Does the CVD Risk Persist in the Menopause? SWAN n=2543, mean age 45.8years Wang et al, 2010 Obstet Gynecol Polotsky et al, 2012, JCEM Metabolic Risk after Menopause Metsyn Stroke MI Obesity and smoking were strongest predictors Patel et al, Endo care, 2009 10
9/30/2017 Non fatal stroke Non fatal CHD Hart et al, 2015, JCEM Oncotarget , 2016 11
9/30/2017 Recommendations JCEM, May 2010 Acknowledgements PENN • Andrea Roe • Jessica Chan • Jennifer Hillman • Laura Cooney Hershey • Richard Legro NHLBI • Nehal Mehta • Martin Playford AEPCOS Society • Terhi Piltonen • Sujata Kar • Ezster Vanky • Gustavo Marciel 12
Recommend
More recommend