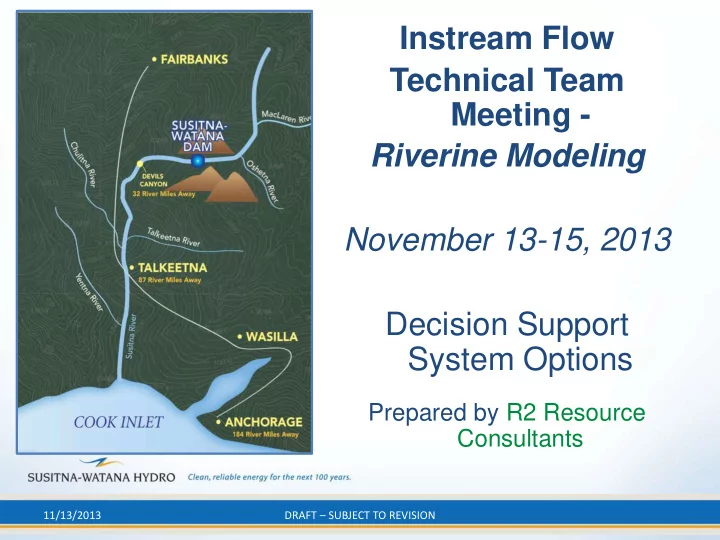
Instream Flow Technical Team Meeting - Riverine Modeling November 13-15, 2013 Decision Support System Options Prepared by R2 Resource Consultants 11/13/2013 DRAFT – SUBJECT TO REVISION
2 Decision Support System - Define • Decision: Choice among options on dam operations (Existing Conditions, Optimum Energy Output, OptA, OptB,....,) • Support System: Framework for evaluating options based on “EVALUATION METRICS” DRAFT – SUBJECT TO REVISION 11/13/13
3 Decision Support System - Goal • “The goal of a decision support system is not to make a decision, but rather to reduce the complexity of information and focus attention on tradeoffs involved in the decision.” (USGS: Auble, et al 2009, DSS for Gunnison River) DRAFT – SUBJECT TO REVISION 11/13/13
4 Decision Support System - RSP • Primary tool for “ Instream Flow Study Integration” (RSP Section 8.5.4.8) • “Evaluate the benefit and potential impacts of alternative operational scenarios” • Focus attention on attributes of highest priority for evaluation of operational scenarios DRAFT – SUBJECT TO REVISION 11/13/13
5 DSS: Important Considerations • Integration • Focus • Simplify • Transparency • Complexity of System/Time/Budget DRAFT – SUBJECT TO REVISION 11/13/13
6 DSS: Structured Decision Making • Requirements: 1. Explicit management alternatives • Actions: Operational scenarios 2. Explicit, quantifiable objectives • Values: Maximize energy output, Maximize chum spawning habitat, etc. 3. Models that predict #2 from #1 • Beliefs: Assumptions, Data DRAFT – SUBJECT TO REVISION 11/13/13
7 DSS: Evaluation Metrics • A set of joint values • Must be quantifiable and spatially and temporally explicit • Could be combined using “ multicriteria methods” DRAFT – SUBJECT TO REVISION 11/13/13
8 DSS: Potential Approaches • Manual Matrix Method • USGS DSS for water management – Gunnison, Upper Yakima, Delaware Rivers • Decision Analysis/Bayesian Belief Networks DRAFT – SUBJECT TO REVISION 11/13/13
9 Matrix Methods • Operational and Flow Scenarios Evaluation Metrics • Some spatial and/or temporal variability included – Future 50 years is weighted average of dry, average, wet years responses – Averaged over Focus Areas in MR • Uncertainties/assumptions are dealt with ahead of time – Choice of “average” flow year; choice of models; HSC methods • Result = decision matrix comparing all operational scenarios for all EMs DRAFT – SUBJECT TO REVISION 11/13/13
10 EXAMPLE SUBSET of a Matrix Resource Existing Area Temporal Scale Spatial Scale Evaluation Metrics (EXAMPLE) Conditions OS1 OS2 OS3 Nov-March average Power over expected 50 year n/a Power Generation (MWh) flow Nov-March minimum Hydrologic over expected 50 year n/a 2Day Low Flow (cfs) flow Geomorphic Floodplain Plant Community Colonization Area Riparian Years 10-20 Reach (acres) Resident Averaged over Geomorphic Grayling weighted usable spawning habitat (ft2) Fish expected 50 year flow Reach Ice processes Median date at year 50 n/a Timing of ice breakup Coho effective spawning/incubation habitat area Anadromous Averaged over Focus Area in FA-104 (Whiskers Slough), averaged over Fish expected 50 year flow expected 50 year flow. Chinook effective spawning/incubation habitat Anadromous Averaged over Focus Area area in FA-104 (Whiskers Slough), averaged over Fish expected 50 year flow expected 50 year flow. Chinook juvenile rearing habitat area in FA-104 Anadromous Averaged over Focus Area (Whiskers Slough), averaged over expected 50 Fish expected 50 year flow year flow. Coho juvenile outmigration habitat area in FA-104 Anadromous Averaged over Focus Area (Whiskers Slough), averaged over expected 50 Fish expected 50 year flow year flow. Chinook adult migration habitat area in FA-104 Anadromous Averaged over Focus Area (Whiskers Slough), averaged over expected 50 Fish expected 50 year flow year flow. DRAFT – SUBJECT TO REVISION 11/13/13
11 Making a Decision From a Matrix • Potentially hundreds of metrics in multiple resource categories • No single optimal choice • Three options: – Multiple Criteria Decision Analysis – Focus on KEY metrics – Leave a huge matrix DRAFT – SUBJECT TO REVISION 11/13/13
12 Multiple Criteria Decision Analysis • Provide weighting of metrics (could be all equal). – Example 1: Number of metrics representing significant decline over existing conditions – Example 2: Weighted average of change from existing conditions, with anadromous fish habitat parameters double weighted. • Decision rule – based methods – Example: Maximize power generation such that flow never drops below a minimum cfs criteria during juvenile rearing season. DRAFT – SUBJECT TO REVISION 11/13/13
13 Making a Decision From a Matrix • Three options: – Multiple Criteria Decision Analysis – Focus on KEY metrics – Leave a huge matrix DRAFT – SUBJECT TO REVISION 11/13/13
14 USGS DSS Approach • USGS uses VBA macros in MSExcel to compute similar decision matrix and show graphics automatically • User inputs flow scenarios and can change some model parameters • Outputs many tables and graphs, as well as decision matrix (red, yellow, green) • Can accommodate multiple criteria analysis DRAFT – SUBJECT TO REVISION 11/13/13
15 Summary of Matrix/DSS Methods • Has been successfully used for FERC licensing • All decision metrics in one matrix • Uncertainty is not explicit – Assumptions are vetted ahead of time or through re -running models under changes to assumptions (after the fact). DRAFT – SUBJECT TO REVISION 11/13/13
16 DSS: Other Options • Decision analysis methods for including uncertainty • Bayesian Belief Networks (BBNs) DRAFT – SUBJECT TO REVISION 11/13/13
17 Decision Analysis/Inclusion of Uncertainty Resource Temporal Spatial Existing Area Scale Scale Evaluation Metrics (EXAMPLE) Assumptions Probability Conditions OS1 OS2 HSC1 0.2 Coho effective Averaged over spawning/incubation habitat area HSC2 0.8 Anadromous Focus expected 50 in FA-104 (Whiskers Slough), Fish Area HSC3 0.2 year flow averaged over expected 50 year flow. Weighted Average DRAFT – SUBJECT TO REVISION 11/13/13
18 Example BBN for Spawning Habitat Operations Flow1 OS1 33.3 Wet Year 5.00 OS2 33.3 Somewhat Wet 20.0 OS3 33.3 Moderate Year 45.0 Somewhat Dry 25.0 Dry Year 5.00 18200 ± 9700 DamOutflow 0 to 3000 10.0 3000 to 6000 30.0 6000 to 12000 40.0 HSC 12000 to 24000 15.0 HSC1 10.0 24000 to 40000 5.00 HSC2 80.0 9400 ± 7400 HSC3 10.0 EffSpawnHab UpwellingLocations 0 to 100 36.9 100 to 1000 6.40 UP1 10.0 1000 to 5000 53.3 UP2 80.0 5000 to 10000 3.35 UP3 10.0 1900 ± 2000 DRAFT – SUBJECT TO REVISION 11/13/13
19 DSS: conclusions • Matrix method will be done • Amount of automation/software not yet determined • May include some explicit uncertainties if possible • BBN interesting, but not planned due to complexities/timing DRAFT – SUBJECT TO REVISION 11/13/13
Recommend
More recommend
Unleash a World of Digital Possibilities—Browse, Share, and Explore Content Without Boundaries