
Responsive Analytics of Highly-Connected Big Data Dr. Peter Janacik, peter.janacik@tu-berlin.de Stream Reasoning Workshop 2016 – TU Berlin, December 8, 2016 www.cit.tu-berlin.de
Linking concepts Graphs Content streams occurs in concept a ff inity favored/ commented Data from social networks posted (Twitter/Instagram), Wikipedia, Wiktionary, evocation/ synonym databases, medical knowledge, etc. Users www.cit.tu-berlin.de 2
Extracting sense from tokens • Approach Lemma Sense • Symbol/token: notion in general, oriented gradient Lemma Sense cluster, recognized object, word • Semantic overlay absorbs flow Lemma Sense of meaning • Follow-up processing Lemma Sense • Polarization and gist extraction • Wikipedia/wiktionary as Lemma Sense knowledge model for semantic overlay Lemma Sense A fu er patiently waiting , a black cat Symbol/token layer www.cit.tu-berlin.de 3
Apache Flink • Was initiated at TU Berlin (first under the name Stratosphere) E • MapReduce does not provide su ff icient means to implement state-of-the-art analysis methods • Flink allows to connect transformations D D (vertices) to a graph using data streams Degree of (directed edges) parallelism is adjustable, • Distributed execution and placement within a C here 2 cluster: Flink program -> subtasks -> slots • Number of slots on one physical node is A B configurable but usually it is equal to number of cores • Maximum degree of parallelism can be defined and is used by Flink during execution www.cit.tu-berlin.de 4
Future Work • Partitioning of data flow graph Cut a E over several data centers based E, F, B, Z in data center 1 on available resources, data stream bandwidth, data privacy F D criteria • Optimization criteria Data streams • Min processing time C B with di ff erent bandwidth • Min costs • Best fit Cut b A Z • Matching di ff erent criteria • Dynamic migration in order to D, C, A in data accommodate changing center 2 characteristics of physical topology (available bandwidth/ resources (nodes), price, follow the sun, etc.) www.cit.tu-berlin.de 5
Interdependence of areas Visualization Comprehensible Data/results presentation Results/ recommendation to trigger Human data/ Concept/ feedback relationship/story generation detection Alters models/algo behavior Enabled by Enabled by Distribution at web- scale for insightful analysis www.cit.tu-berlin.de 6
Semantic graph as result of analysis www.cit.tu-berlin.de 7
Semantic graph as result of analysis www.cit.tu-berlin.de 8
Instagram interaction heat map www.cit.tu-berlin.de 9
Instagram interaction heat map www.cit.tu-berlin.de 10
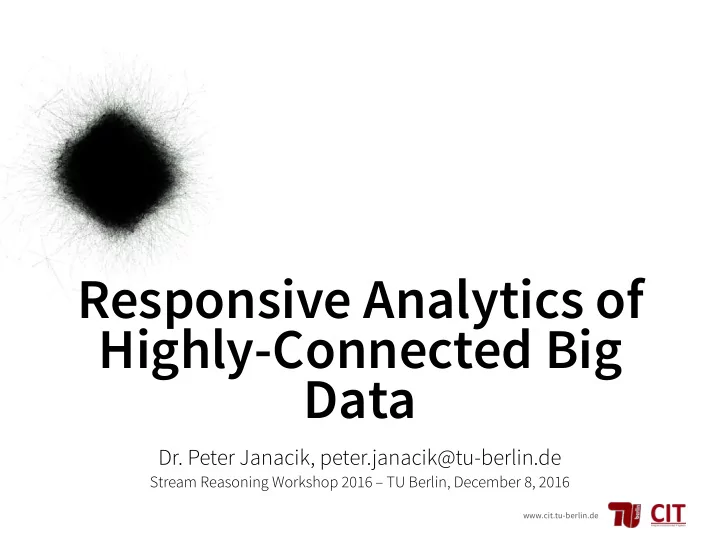
Semantic graph as result of analysis But how to visualize, what these graphs are about, when there are typically millions to trillions of edges? www.cit.tu-berlin.de 11
Approaches to visualization • 2-dimensional • Works well with most of the currently available devices, no special hardware needed • Supported by broad range of platforms • Less complex, easier to implement • Fewer problems with readability and overlap www.cit.tu-berlin.de 12
Approaches to visualization • 3-dimensional • Chance to make use of additional dimension to untangle the big graph • Di ff erent perspectives may cover di ff erent aspects/lead to di ff erent conclusions • Can exploit the full potential of touch interfaces www.cit.tu-berlin.de 13
Responsive Analytics of Highly-Connected Big Data Dr. Peter Janacik, peter.janacik@tu-berlin.de Stream Reasoning Workshop 2016 – TU Berlin, December 8, 2016 www.cit.tu-berlin.de
Recommend
More recommend