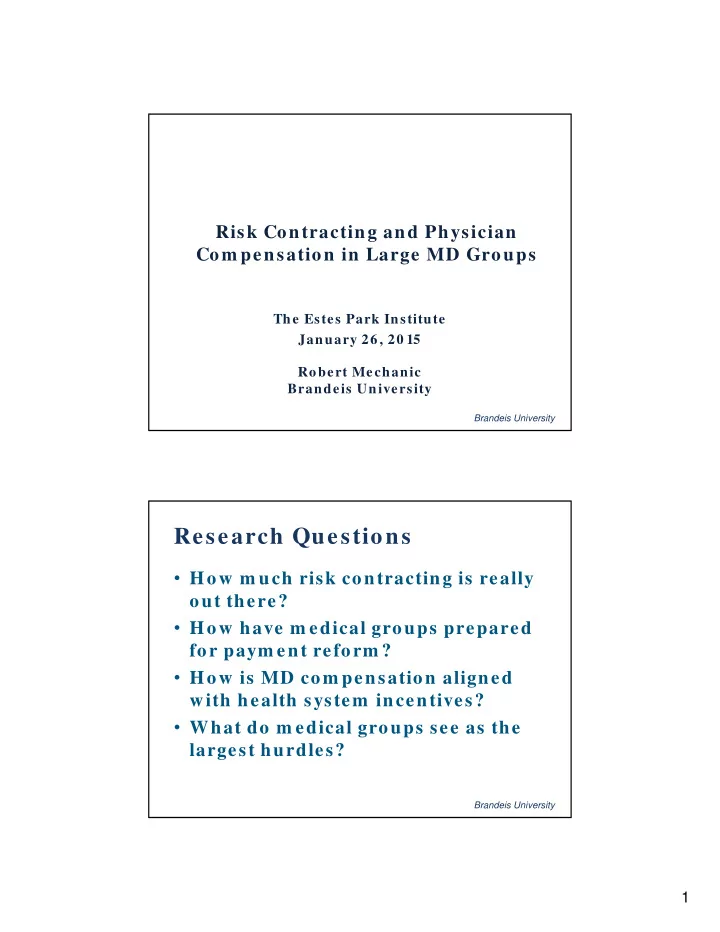

Risk Contracting and Physician Com pensation in Large MD Groups The Estes Park Institute January 26, 20 15 Robert Mechanic Brandeis University Brandeis University Research Questions • How m uch risk contracting is really out there? • How have m edical groups prepared for paym ent reform ? • How is MD com pensation aligned with health system incentives? • What do m edical groups see as the largest hurdles? Brandeis University 1
Surveyed Groups (Fall 2011) Atrius Health Group Health Physicians Mayo Clinic Austin Regional Clinic Health Care Partners Oschner Health System Billings Clinic HealthPartners Medical Group Palo Alto Medical Foundation Dean Health System Henry Ford Medical Group Scott & White Healthcare The Everett Clinic Intermountain Medical Group Sharp Rees ‐ Stealy Med Group Fallon Clinic Kaiser Permanente Med Group Virginia Mason Medical Group Geisinger Health System Marshfield Clinic Wenatchee Valley Med Center Brandeis University Num ber of FTE Physicians by Type 1,000 900 800 700 600 500 400 300 200 100 ‐ 1 2 3 4 5 6 7 8 9 10 11 12 13 14 15 16 17 18 19 20 Primary Care MDs Specialist MDs Hospitalist MDs Brandeis University Note: Excludes the Permanente Medical Group. 2
Facility and Health Plan Ownership 80.0% 67.0% 70.0% 57.0% 57.0% 60.0% 50.0% 43.0% 40.0% 30.0% 24.0% 20.0% 10.0% 0.0% Hospital Skilled Nursing Ambulatory Health Plan Physician ‐ Only Facility Surgery Center Brandeis University Source: Self-reported survey data from 21 CAPP medical groups. Paym ent Profile Brandeis University 3
Type of contract as a percent of total patient revenue Global Capitation, 25% Partial Capitation, Fee for Service, 5% 54% Shared Risk, 3% Shared Savings, 2% FFS ‐ Affiliated Plan, 8% FFS w/P4P, 3% Note: Calculated as a simple (unweighted) average (n= 21). Brandeis University 20 10 Patient Revenue by Contract Type FFS-based Risk-based 100% 90% 80% 70% 60% 50% 40% 30% 20% 10% 0% 1 2 3 4 5 6 7 8 9 10 11 12 13 14 15 16 17 18 19 20 21 FFS Affiliated Health Plan Risk Brandeis University Source: Self-reported survey data from 21 CAPP medical groups. 4
Physician Com pensation Brandeis University 20 10 PCP Com pensation Method FFS-based Risk-based 100% 90% 80% 70% 60% 50% 40% 30% 20% 10% 0% 1 2 3 4 5 6 7 8 9 10 11 12 13 14 15 16 17 18 19 20 21 Production Salary Performance Other Brandeis University Source: Self-reported survey data from 21 CAPP medical groups. 5
Group Paym ent vs. PCP Com pensation 100% Percent of Compensation Based on 90% 80% 70% Productivity 60% 50% 40% 30% 20% 10% 0% 0% 10% 20% 30% 40% 50% 60% 70% 80% 90% 100% Risk Contracts as Percent of Total Revenue Brandeis University One example: Dean Clinic transition toward a value- based compensation plan (specialty) Value FFS/Volume Source: Craig Sammit, MD Based Based Page 12 6
One example (continued) Dean Clinic Realignment of Primary Care Compensation Dean PCMH Compensation Model Transition 100% 95% 115% 115% 10% 10% 100% 10% 10% 2% 15% 15% 80% Efficiency 20% 20% Quality 60% Service 20% 98% 95% 40% Panel Size 60% RVUs - 5% 20% 40% RVUs 0% Salary 2009 2010 2010 Future? Option A Option B Source: Craig Sammit,,MD Page 13 Operating Characteristics Brandeis University 7
System Assets by Type of Group 90.0% 80.0% 80.0% 80.0% 73.0% 70.0% 64.0% 60.0% 50.0% 50.0% 45.0% 40.0% 36.0% 40.0% 30.0% 20.0% 10.0% 0.0% Hospital Skilled Nursing Ambulatory Health Plan Facility Surgery Center FFS Groups Risk Groups Brandeis University Source: Self-reported survey data from 21 CAPP medical groups. Data Managem ent Capacity Percent of Groups Reporting “Fully Im plem ented” Shared electronic health record Results management Data warehouse & analytic software Patient disease registries Physician and patient reminders 0% 20% 40% 60% 80% 100% 120% Risk ‐ Based (N=11) FFS ‐ Based (N=10) Source: Author’s analysis of self-reported survey data from 21 CAPP medical groups. Brandeis University 8
Perform ance Im provem ent Initiatives Percent of Groups Reporting They are “Far Along” Reduce avoidable admissions & readmissions Reduce network leakage Establish preferred relationships with efficient hospitals & specialists Mgmt. Programs for High Risk Patients Patient engagement initiatives 0% 20% 40% 60% 80% 100% Risk ‐ Based (N=11) FFS ‐ Based (N=10) Brandeis University Source: Author’s analysis of self-reported survey data from 21 CAPP medical groups. Attitude toward expanding future risk contracting (n=15) • All expect expanded risk contracting • 11 groups seeking new risk contracts • 3 were preparing for paym ent system change • 1 group not interested Brandeis University 9
What are the largest challenges to increasing your revenue from alternative paym ent contracts? (N=14) Need to improve care management capabilities Need to improve data management and information systems PPO ‐ dominated market not appropriate for risk contracting Payer willness to offer risk contracts Physician and staff resistance 0% 20% 40% 60% 80% 100% 120% Very Important Somewhat Important Brandeis University Source: Author’s analysis of self-reported survey data from 21 CAPP medical groups. Conclusions and Issues • “Many large m edical groups will need to acquire new skills and tools to be ready for paym ent reform ”, Hea lth Affa irs Sept 20 12 • Significant challenges and cost to im plem ent these changes broadly • Sources of capital for infrastructure? – Insurers? – Hospitals? – Governm ent? Brandeis University 10
Thank You Robert Mechanic Senior Fellow Heller School for Social Policy & Mgm t. Brandeis University m echanic@brandeis.edu http:/ healthforum .brandeis.edu Brandeis University 11
Recommend
More recommend