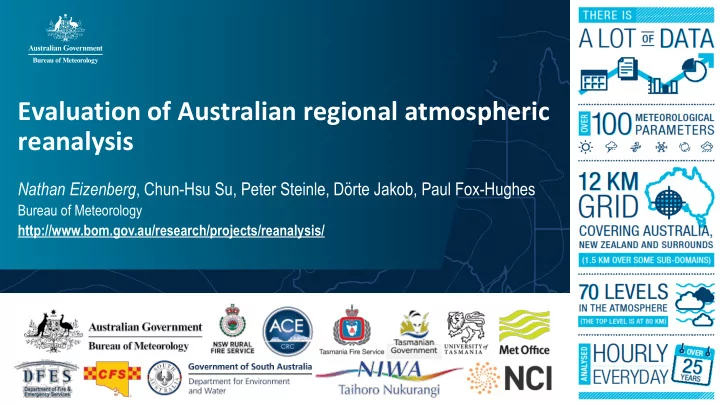

Evaluation of Australian regional atmospheric reanalysis Nathan Eizenberg , Chun-Hsu Su, Peter Steinle, Dörte Jakob, Paul Fox-Hughes Bureau of Meteorology http://www.bom.gov.au/research/projects/reanalysis/
BARRA – Bureau of Meteorology Atmospheric high- BARRA – Bureau of Meteorology Atmospheric high- resolution Regional Reanalysis for Australia (1990-2017) resolution Regional Reanalysis for Australia (1990-2017) Nested in ERA-Interim BARRA-xx (1.5 km) - Dynamical downscaling of BARRA-R BARRA-SY BARRA-PH BARRA-AD OSTIA SST/SICE BARRA-TA boundary BARRA-R (12 km forecast model, 36 km 4dVAR) Domains of BARRA-R (assimilation & hindcast system) and BARRA-xx (dynamical downscaling systems) . BARRA-R system is based on UK Met Office UERRA reanalysis system.
Heatwave in Sydney, New South Wales " NSW recorded a statewide average maximum temperature of 35.34 °C during January, 3.66 °C above the historical average. This is the third warmest January since records began in 1910, and the warmest for NSW since 1939. " – Bureau of Meteorology Monthly Climate Summary 5 km 80 km 12 km 1.5 km Hottest at 46.5°C Daily maximum temperature on 18 January 2013. Penrith Lakes The locations of weather stations are overlaid over the AWAP (Jones et al., 2007) grid.
Cyclone Yasi, 3 February 2011 " Yasi is one of the most powerful cyclones to have affected Queensland since records commenced." – Bureau of Meteorology 25 km 12 km 80 km 6-hourly rainfall accumulation from TRMM/TMPA (satellite, first row), BARRA-R (second row), and ERA-Interim (last row), central pressure track in red
Cyclone Yasi, 3 February 2011 " Yasi is one of the most powerful cyclones to have affected Queensland since records commenced." – Bureau of Meteorology Source: Bureau of Meteorology 10 m wind speed forecast at 18 February 2011, 18 UTC from ERA-Interim and BARRA-R. Last plot shows the instantaneous 10 m wind gust (10 min) from BARRA-R.
Screen temperature (2011) 𝐹 [ 𝑛 ]− 𝐹 [ 𝑝 ] Evaluation of T+6h forecast valid at 6 and 18 UTC; thus using the observations outside the analysis window. Boxplots showing the distribution of metrics across stations in the BARRA-SY domain.
10 m wind speed (2011) 𝐹 [ 𝑛 ]− 𝐹 [ 𝑝 ] Evaluation of T+6h forecast valid at 6 and 18 UTC; thus using the observations outside the analysis window. Boxplots showing the distribution of metrics across stations in the BARRA-SY domain.
Precipitation (2010-15) 5 km 25 km 80 km 12 km Mean annual precipitation, fraction of light rain days (1-10 mm), and fraction of very wet days (> 50 mm)
Precipitation (2010-15) AWAP BARRA-R BARRA-SY ERA-Interim Fractions of very wet days from AWAP, BARRA-R, BARRA-SY, and ERA-Interim.
Precipitation (2010-15) BARRA-R BARRA-SY ERA-Interim Frequency histogram of daily precipitation. Comparison against AWAP.
Pressure level wind (2010-2013) RMSD [m/s] Comparisons of BARRA-R analysis, ERA-Interim analysis and BARRA-R forecast ( T+6h forecast) against GRASP pilot balloon and radiosonde observations valid at 0 and 12 UTC (Ramella Pralungo, et al. 2014). Boxplots showing the distribution of metrics across sites.
Conclusions Completed 10-year reanalyses BARRA-R, BARRA-SY, BARRA- • TA, BARRA-PH BARRA show realistic details at 12 km and 1.5 km resolution • at surface or near-surface BARRA appears more realistic during high impact weather • BARRA shows better agreement with point-scale • observations than ERA-Interim, even after areal-to-point interpolation Downscaled reanalyses (BARRA-xx) improve upon BARRA-R • Negative biases in wind speed persist – under investigation • and to be addressed via post-processing Difficult to discern differences between BARRA-R and ERA- • Interim for upper air temperature and wind.
Drew Whitehouse @NCI/ANU
Recommend
More recommend