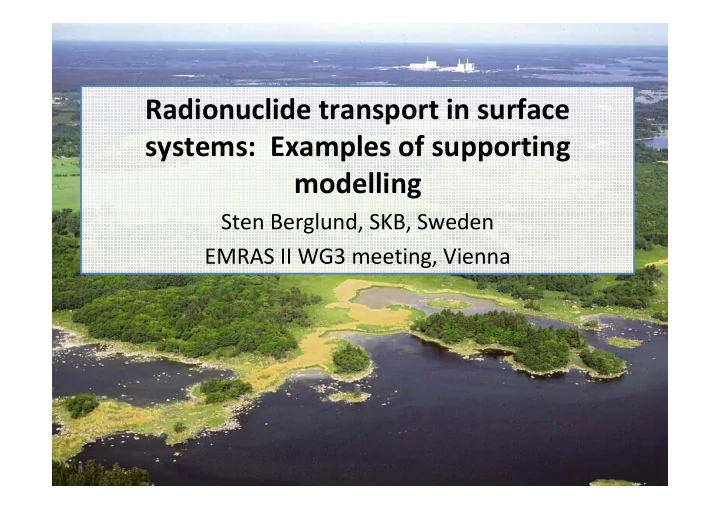

Radionuclide transport in surface systems: Examples of supporting modelling Sten Berglund, SKB, Sweden EMRAS II WG3 meeting, Vienna
Objective and contents • Background on the Swedish concept and geological conditions. • Examples of modelling performed to support the dose modelling and PA. • Questions for further discussion. When a programme is at the stage where specific sites are considered, site data and site models provide the main support to the PA. The aim is to show some examples of how this is done in the Swedish programme.
Background: The Swedish repository concept • Repository depth: 400–700 m • Underground facilities: 2–4 km 2 • 6,000 canisters
Background: Geology and hydrogeology “Old” rock (~ 10 9 years), “young” soils/deposits (~ 10 4 years). • • Thickness of deposits: a few metres, up to 30m in valleys. • Clays and organic deposits in potential discharge areas.
Background: Transport from repository to surface
Notes on different types of models • Models used in performance assessment are by necessity simplified: – Coarse discretisation (box models) – Simplified hydrology (turnover times) – Processes described by distribution factors (e.g. Kd ). • Simplifications need to be tested and motivated. • Some inputs need to be calculated by more detailed models (e.g. water fluxes).
Examples of modelling tasks • Flow and transport in hypothetical discharge areas: – Model discretisation – Detailed flow paths and discharge locations – Quantification of water fluxes • Analysis of retention processes: – Identification of processes that can be active at the site – Process quantification in numerical model • Flow and transport in a changing landscape
Discharge areas I: Develop flow model Forsmark area c. 37 km 2
Discharge areas II: Illustrate flow directions and identify recharge and discharge areas
Discharge areas III: Transport modelling
SZ conc (g/m3) 1 yr 10 yrs 25 yrs 50 yrs 100 yrs
Retention I: Evaluate chemical data from the site 0.06 -7 Till water Stream water -7.5 0.05 Lake water -8 0.04 mol/l) Sr (mmol/l) -8.5 log[Th] ( 0.03 -9 0.02 -9.5 0.01 -10 -10.5 0 -7 -6 -5 -4 -3 0.0 2.0 4.0 6.0 8.0 10.0 12.0 14.0 Ca (mmol/l) log[Fe] (mol/l) -1 0.003 Till -1.5 Lake & wetland 0.002 log [Th] (mmol/kg) -2 [Sr] (mol/kg) 0.002 -2.5 0.001 -3 0.001 -3.5 Till sed Lake & wetland sediments -4 0.000 0.5 1 1.5 2 2.5 3 3.5 0.0 1.0 2.0 3.0 4.0 5.0 6.0 log [Fe] (mmol/kg) [Ca] (mol/kg)
Retention II: Identify processes and develop conceptual model for selected radionuclides 14 C 129 I 36 Cl 94 Nb 59 Ni 93 Mo 79 Se 99 Tc 230 Th 235 U 135 Cs 90 Sr 226 Ra Retention process � � Sorption onto organic matter � � � Sorption onto Fe-Mn-Al oxyhydroxides � � � � � Sorption onto phyllosilicates � � � � � � � � Precipitation as pure phases Association with sulfides � Association with carbonates Incorporation into bacteria Association with phosphates � Association with sulfates � Processes likely to be active in the QD of Forsmark Available thermodynamic data Processes not likely to be active in the QD of Forsmark Retention processes not relevant for the indicated element Note: preliminary results!
Retention III: Quantify effects of processes using transport model Sorption of Sr by two different processes 2D model domain Sorption of Cs
Retention IV: Calculate ”Kd values” (concentration ratios) Uranium Strontium
Changing hydrology I: Shoreline displacement and model areas Changes affecting hydrology: ‐ Shoreline displacement ‐ Processes affecting deposits ‐ Lake succession ‐ Stream network ‐ Climate: glaciation cycle (permafrost conditions ), possibly ”delayed” by global warming
Changing hydrology II: Discharge areas in future land areas Are the new land areas different from the present ones?
Changing hydrology III: Discharge from repository release in/around future lakes, streams and wetlands
Changing hydrology IV: Export to dose models LAKE+MIRE MIRE LAKE MIRE OL in Net prec Net prec OL out OL to L1 L1 to OL L1 in OL in L1 out L1 to L2 L2 to L1 OL out L2 in L2 out L1 in OL to L1 L1 to OL L2 to L3 L3 to L2 OL L1 out L2 in L1 to L2 L2 to L1 L1 L2 out L2 to L3 L3 to L2 L2 L3 Water balance figure
Questions for discussion • Which aspects of PA models need support and how much modelling should be done for this purpose? • Generic vs site specific assessments – what can and should be done at different stages? • Distributed models vs box models – how to organise and discretisise models? • …
Recommend
More recommend