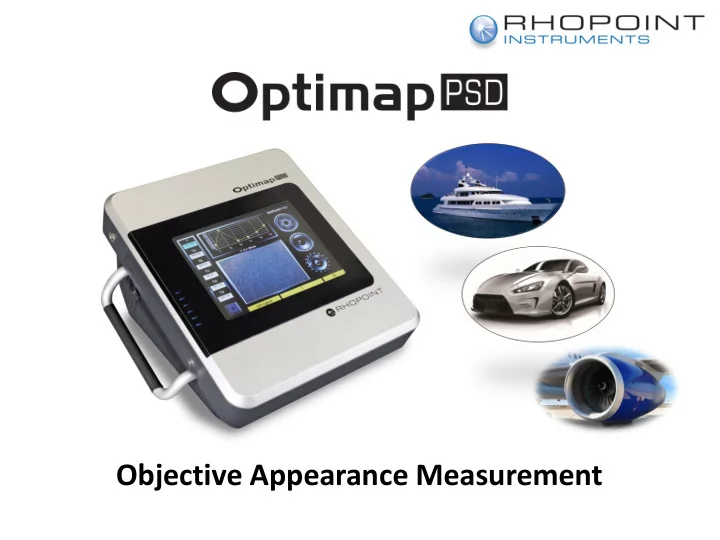

Objective Appearance Measurement
Appearance of surface finish Many factors can affect surface appearance quality These include:- • Surface texture or waviness (Orange Peel)
Appearance of surface finish Many factors can affect surface appearance quality These include:- • Defects – inclusions, scratches, dents, pinholes.
Appearance of surface finish Quantifying these effects is problematic • Waviness – Profilometry (Laser / Stylus) • Defects – Confocal Microscopy / Interferometry Photography!!! Both methods are either time consuming or lack detail and definition making detection and analysis difficult
• Unique handheld measurement solution for quantifying appearance quality
What is Optimap? • Maps, measures and quantifies surface appearance quality • Objectively measures surface texture and waviness • Identifies and locates common surface defects • Produces detailed full field 3D surface images • Displays images in traceable SI units (m¯ 1 ) or in standard industrial scales • Requires no movement over the surface
How does Optimap work? • Phase Stepped Deflectometry. • A white light optical technique • Provides fast, full field, non contact surface measurement. • A periodic sinusoidal waveform is projected onto the surface • and the reflected image captured.
How does Optimap work? • The pattern acts like a ruler across the surface allowing each point (X, Y, Z) to be mapped. • By phase stepping the pattern across the surface in both directions each point on the surface is spatially modelled, • to accurately calculate the curvature at each point.
How does Optimap work? • Consider a surface (green) compared to its normal shape • An observer is unlikely to notice the gradual variation across the whole surface • But will notice the sharp deviation
How does Optimap work? The second Altitude derivative of altitude (z) produces a Slope curvature profile that is more representative of what the human Curvature eye really sees Position
How does Optimap work? 95 x 70mm Global surface curvature map (K)
Why use Optimap? High quality surfaces are often evaluated visually
Why use Optimap? Large Waves Small Waves Appearance changes according to structure size
Why use Optimap? Visibility of structures is dependant on the observation distance
Why use Optimap? Visibility of structures is dependant on the observation distance
Why use Optimap? Value Wavelength K 0.1 – 30mm Ka 0.1 – 0.3mm Kb 0.3 – 1.0mm Kc 1.0 – 3.0mm Kd 3.0 – 10mm Ke 10 – 30mm
Why use Optimap? • By applying standardised equations to curvature values • Optimap calculates the correlated value of Waviness for each wavelength band • These values are displayed as Texture (T), (Ta – Te), (TL-TS) • Provides a best fit correlation from a dimensionless single scan measurement to an objective full field traceable scale
Why use Optimap? Value Wavelength T 0.1 – 30mm Ta 0.1 – 0.3mm Tb 0.3 – 1.0mm Tc 1.0 – 3.0mm Td 3.0 – 10mm Te 10 – 30mm
Why use Optimap?
Why use Optimap?
Why use Optimap? Evaluation of defects is subjective
Why use Optimap? Making measurement difficult and time consuming
Why use Optimap? High resolution data can be transferred to PC allowing post processing in Rhopoint Ondulo Reader Software Simple data transfer using USB key included
Why use Optimap? Predefined analyses in Ondulo Reader allow conversion of curvature data (m¯¹) into altitude in μ m Surface effects including texture and local defects can be identified and analysed.
Why use Optimap? μ m 3D Viewer allows full 360°rotation of image topology
Why use Optimap? Profiles of curvature or altitude can be characterised Y Altitude μ m X - X X X Altitude μ m Y Y - Y Cross sectional viewer allows accurate characterisation of defect
Why use Optimap? Drag and drop images and data into Microsoft Word for instant reporting
Why use Optimap? Images can be saved in a variety of different formats .jpeg .tiff .png .xls .sdf
Why use Optimap? .xls format stores each 75 μ m X,Y,Z point across surface allowing advanced analysis within Microsoft Excel
Why use Optimap? sdf format .sdf format stores surface data as an SQL database
Why use Optimap? Identify and quantify common surface defects Blistering Orange Peel
Why use Optimap? Identify and quantify common surface defects Water Stain Overspray
Why use Optimap? Identify and quantify common surface defects Sagging Inclusions
Which surfaces can be measured? Optimap can be used on a wide range of surfaces from ultra low gloss ……..
Which surfaces can be measured? To mirror gloss finish
Which surfaces can be measured? Allowing detailed analysis of each stage of the coating process
Benefits of using Optimap • Full Field 3D measurement with spatial resolution 75 μ m • Detailed analysis of waviness, texture and common defects • Produces detailed full field 3D surface images • Reporting in traceable SI units (m¯ 1 ) and microns • Can be used on a wide range of surface finishes from ultra low gloss to mirror finish
Defects Detection Software NEW! Advanced software for the analysis of surface defects
Defects Detection Software NEW! Automatically analyse defects in any image In Curvature (m¯¹) or Altitude ( μ m)
Defects Detection Software NEW! Capture all defects above and below user definable thresholds
Defects Detection Software NEW! Using user definable limits, select and display - • Number of defects • Surface Area (mm²) – of defects above / below limits • Aspect Ratio – the ratio of defect height and width • Weighted Surface – weighted sum of each defect pixel • Sign – (+/-) direction of defect in the surface • Span Length - maximum length of defect • X/Y Span Length – mid-length of defect in X/Y directions
Defects Detection Software NEW! Overlay defects analysis on original image
Defects Detection Software NEW! Drag and drop defect analysis into Microsoft Word for instant reporting
Portable objective surface quality measurement
Recommend
More recommend