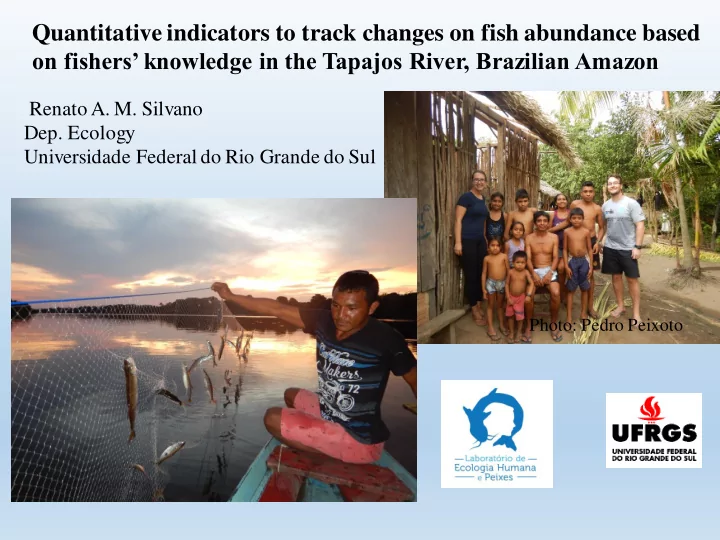

Quantitative indicators to track changes on fish abundance based on fishers’ knowledge in the Tapajos River, Brazilian Amazon Renato A. M. Silvano Dep. Ecology Universidade Federal do Rio Grande do Sul Photo: Pedro Peixoto
Research Project: Linking sustainability of small-scale fisheries, fishers’ knowledge, conservation and co -management of biodiversity in large rivers of the Brazilian Amazon PEER Cycle 4 Grant Award Number: AID-OAA-A-11
Mekong Mackenzie Tapajos
Tapajós River Communities River Lake RESEX Tapajos-Arapiuns 1998 ➢ 8 fishing communities, 4 inside X 4 outside (red squares) Extractive Reserve (RESEX): comparison
Main goal: 5 quantitative indicators to track changes on fish availability from fishers ’ knowledge (interviews) 1) Fish size : indicated in a tape 2)Temporal trends on fish abundance: increased, same or decreased ✓ 3) Composition of catches: species of fish cited (already presented) 4) Biomass of fish caught (kg) 5) Catch per unit of effort (CPUE) of fish caught: kg/h x n of fishers
Methods ✓ Interviews with fishers: standard questionnaire with 31 questions addresing fishing practices, socioeconomic issues, local knowledge, management ✓ Snow-ball sampling: 161 fishers interviewed, 10 to 20 fishers in each studied community
Questions about fish: 1) Which are the most caught fish species (list 5)? 2) Which is the average size of these fish (show in a metric tape)? 3) Do you think that the abundance of these fish has increased, decreased or remained the same over the las 20 years? 4) How much fish (kg) do you regularly catch? 5) How many hours you take to cath this amount of fish and with how many people? Actual Past (20 years ago) 2006 1996 2016 RESEX Tapajós-Arapiuns
1) Fish size: citations of size estimates for 12 commercial fish species (or groups of species) in both time periods 350 300 PERIOD 250 Actual ) m Past (20 years) c 200 ( e z i s 150 h s i F 100 50 0 Aracu Caratinga Dourada Filhote Jaraqui Mapara Pacu Pescada Pirarucu Surubim Tambaqui Tucunare Fish
Larger fish in the past, no difference between RESEX and outside 300 Period 270 Actual 240 20 years ago 210 ) m 180 c ( e 150 z i s h 120 s i F 90 60 30 0 Outside RESEX Region
2) Comparison of abundancetrends, for each fish species: Increased= +1, Same = 0, Decreased = -1 (X proportion of fishers) REGION 1.0 RESEX outside 0.6 d n All fish decreasedin abundance, except a e r small, less valuablefish insideRESEX t 0.2 e c n a d -0.2 n u b A -0.6 -1.0 u á ó a a a o a e a i á u a u u a m i é u u c r c h g m t d t ç r c d a c d r q q u u o a i a a o a b n n a l a i u r a a P a r e r h p a n r B P u i i a r c r a u t c r b A r u l a a S u a i s r e h a r q F - m o M r u c a r a e p C J i n a D P S u B r P a a a u C T T h r F B C Fish species
4) Biomass of fish caught (kg): more fish in the past, no difference between RESEX and outside (OUT X) 4 Period Actual Log10 (Fish Biomass kg) 20 years ago 3 2 1 0 OUT X RESEX Region
5) CPUE: higher CPUE in the past, no difference between RESEX and outside (“Fora”) 3 Period Actual h 20 years ago s 2 i f E U P C 0 1 g 1 o L 0 Fora RESEX Region
Biomass, CPUE and temporal trends indicated same patterns Temporal change, few effects of RESEX Indicators Temporal Influence of change? RESEX? Fish composition of catches No No Temporal abundance trends Yes No Fish size Yes No Biomass of fish caught Yes No CPUE of fish caught Yes No
We made 16 meetings with fishers in all fishing communities to discuss some of the results of the research. Photo: Daiana Scneider
Acknowledgments ➢ To fishers for their cooperation ➢ To USAID for funding the research ➢ The research team ➢ To Tracking Change Project and SSHRCC ➢ To you by your attention Questions??
Recommend
More recommend