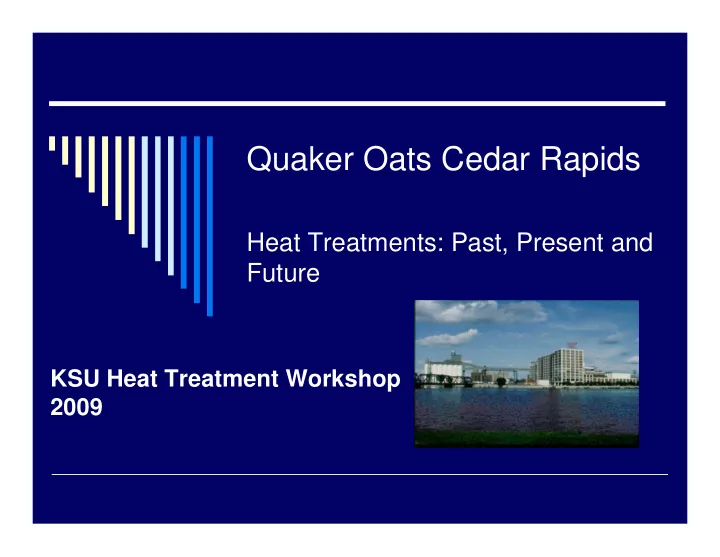

Quaker Oats Cedar Rapids Heat Treatments: Past, Present and Future KSU Heat Treatment Workshop 2009
Summary Heat Treatment / Remediation Evolution – Long History Current Challenges Future State Flood of ’08 The event and recovery - Heats Challenges / Learnings
QO Cedar Rapids Heat History Cedar began use of heat in the mid-1960s Used everything else prior (methyl, malathion, etc.) Lots of makes/sizes of heaters over time Systems run off of steam Readily available from Alliant energy Simple technology / milling and extrusion Temperature / time requirements “Art vs. Science” Lots of history in heating
Temperature – Time Requirements The Response of stored-product insects to temperature* Temp ( ˚ F) Effect Zone Lethal 122 - 140 Death in minutes 113 - 121 Death in hours Suboptimum 96 - 112 Development stops 91 - 95 Development slows Optimum 77 - 94 Maximum rate of development Suboptimum 55 - 76 Development slows 55 - 68 Development stops Lethal 41 Death in days (unacclimated), movement stops 14 - 23 Death in weeks to months (acclimated) - 13 - 5 Death in minutes, insects freeze *Species, stage of development and moisture content of food will influence the response to temperature (Fields, P.G. (1992) The Control of Stored-Product Insects and Mites with Extreme Temperatures. J. stored Prod. Res. 28, 90)
Heat Evolution Staffing changes / monitoring electronically vs. manual Entire plant vs. selective areas – “Big/Small” heats Several things prompted: Costs – labor at the time Flexibility – run adjacent areas Improved monitoring for activity / spraying selected areas / other treatment options IPM policy / development of trigger levels
Heat Evolution Monitoring methods - Electronic Safety considerations Still need to “adjust” heat for effectiveness Need to walk floor for observing upset conditions due to temp Growing # of options out there (wireless/remote/Hobos/ etc.) - Manual Thermometers
Heat Evolution C- CRNMILL-8-3 3137 CRNMILL-8-2 CRNMILL-8-4 3135 3153 C- C- CRNMILL-8-5 CRNMILL-8-1 • Example of current map Used during heat monitoring Corn Mill – 8 th Flr
Challenges Scheduling of heat “events” / finding downtime Production / Engineering Areas not set-up for heat or adequate capabilities Portables / Spot Treat Electronic equipment Start-up curve Maintenance support Aging equipment Support during heat start-up Safety of employees Cold spots / adjustments Catastrophes Monitoring equipment upgrades/changes Changing technology
Heats - Future State Focused Improvement Rounds staffing / develop “run rules” Electronic controls vs. manual on heaters Maintain effectiveness + eliminate wasted utilities Ability to do specific areas Heaters / fans flexibility and portability Move from heating entire floors to “spot” treatments Add portable heater capabilities Time constraints – Minimize line disruption Personal safety – Minimize time spent in high temperatures
Flood of June ’08 – Quaker Cedar Rapids – The Event
Flood of June ’08 – Quaker Cedar Rapids – The Event
Flood of June ’08 – Quaker Cedar Rapids – The Event
Flood of June ’08 – Quaker Cedar Rapids – The Event
Flood of June ’08 – Quaker Cedar Rapids – The Recovery Facility Heat capabilities “wiped” out in key 1 st /Basement areas Warmest part of year Recovery process created other issues Moisture in basements created need to dry for dual- purposes
Flood of June ’08 – Quaker Cedar Rapids – The Recovery Crisis event management Big “learning curve” in compressed time frame Controlled ramp up of heat to meet Quaker specifications / effective kill Large Audience!!
Flood of June ’08 – Quaker Cedar Rapids – The Recovery
Flood of June ’08 – Quaker Cedar Rapids – The Recovery
Flood of June ’08 – Quaker Cedar Rapids – The Recovery
Flood of June ’08 – Quaker Cedar Rapids – The Recovery
Flood of June ’08 – Quaker Cedar Rapids – The Recovery
Recommend
More recommend