Proximal Graphical Event Model IBM Research Debarun Bhattacharjya, - - PowerPoint PPT Presentation

proximal graphical event model
SMART_READER_LITE
LIVE PREVIEW

Proximal Graphical Event Model IBM Research Debarun Bhattacharjya, - - PowerPoint PPT Presentation

Proximal Graphical Event Model IBM Research Debarun Bhattacharjya, Dharmashankar Subramanian, Tian Gao Objective: To learn statistical and causal relationships between event types in the form of graphical models using event datasets Home health


slide-1
SLIDE 1

IBM Research

Proximal Graphical Event Model

Debarun Bhattacharjya, Dharmashankar Subramanian, Tian Gao

1

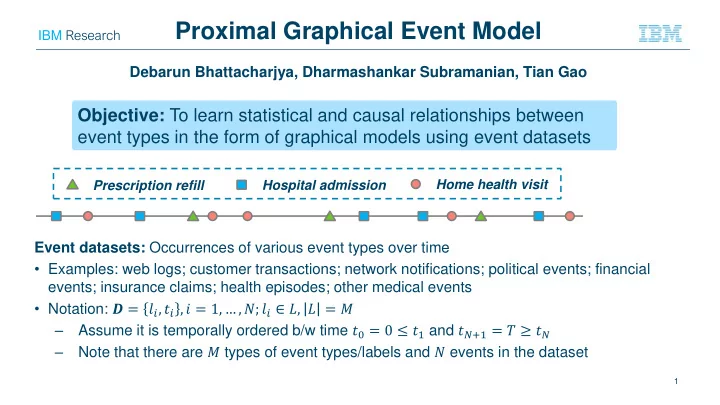
Event datasets: Occurrences of various event types over time

  • Examples: web logs; customer transactions; network notifications; political events; financial

events; insurance claims; health episodes; other medical events

  • Notation: 𝑬 = 𝑚𝑗, 𝑢𝑗 , 𝑗 = 1, … , 𝑂; 𝑚𝑗 ∈ 𝑀, 𝑀 = 𝑁

– Assume it is temporally ordered b/w time 𝑢0 = 0 ≤ 𝑢1 and 𝑢𝑂+1 = 𝑈 ≥ 𝑢𝑂 – Note that there are 𝑁 types of event types/labels and 𝑂 events in the dataset

Objective: To learn statistical and causal relationships between event types in the form of graphical models using event datasets

Prescription refill Hospital admission Home health visit

slide-2
SLIDE 2

IBM Research

Proximal Graphical Event Model (PGEM)

2

  • PGEM = 𝐻, 𝑋, Λ ; graph + set of (time) windows on each edge

and conditional intensity parameters

  • Assumption: The intensity of an event label (node) depends on

whether or not its parents have happened at least once in their respective recent histories

B A C

waa wac wbc wab

Formally, denoting a node 𝑌’s parents as 𝑽:

  • 𝐻 = 𝑀, 𝐹 where 𝑀 is the event label set
  • There is a window for every edge, 𝑋 = 𝑥𝑦: ∀𝑌 ∈ 𝑀 , where 𝑥𝑦 = 𝑥𝑨𝑦: ∀𝑎 ∈ 𝑽
  • There is an intensity parameter for every node 𝑌 and for every instantiation 𝒗 of

its parent occurrences, Λ = 𝜇𝑦|𝒗

𝑥𝑦 : ∀𝑌 ∈ 𝑀

slide-3
SLIDE 3

IBM Research

Parameter and Structure Learning

3

Learning problem: Given an event dataset 𝑬, learn PGEM = 𝐻, 𝑋, Λ

  • Log-likelihood:

– 𝑂 𝑦; 𝒗 : # of times 𝑌 is observed and the condition 𝒗 is true in the relevant windows – 𝐸 𝒗 : duration over the entire time period where the condition 𝒗 is true

  • For a given graph, finding the optimal (MLE) conditional

intensities when given the windows is easy, but finding the

  • ptimal windows is hard!
  • Contribution 1: Analysis and proof that reduces the window

search to a finite set that is algorithmically constructed.

  • Contribution 2: A method to search over graph structures,

with some theoretical results on efficient search and consistency justification

slide-4
SLIDE 4

IBM Research

Results: Synthetic Datasets

4

Wed Dec 5, 5:00 – 7:00 pm, Room 210 & 230 AB #6