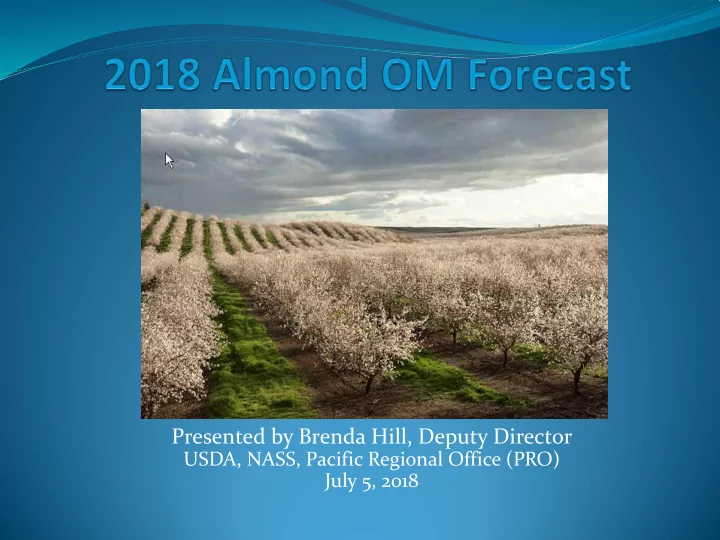

Presented by Brenda Hill, Deputy Director USDA, NASS, Pacific Regional Office (PRO) July 5, 2018
Almond Subjective Forecast vs. Final Production 1998-2018 2.45 2.30 Final 2.15 Subjective 2.00 1.85 Billion Pounds 1.70 1.55 1.40 1.25 1.10 0.95 0.80 0.65 0.50
Almond Objective Forecast 1,070,000 bearing acres in 2018 Sample: 853 orchard blocks 2 trees per orchard block Sample represents the population Field Work: May 29 – June 26 Use 50+ Enumerators Random Path Method Sample of Nuts taken and sent to sizing station Sizers measure kernel weight, length, width, thickness and grade
Nuts being weighed at a sizing station
Sample & OM Models Samples are designed to take into account variety, location, and age of planting Models are designed to produce a forecast of all almond production at the state level from the sample data Models do not forecast production by variety. Separate models are run for Nonpareil since there are a significant number of samples.
ALMOND PRODUCTION - CALIFORNIA OM Forecast vs Final Estimate 2,400 2,270 2,300 2,140 2,200 2,100 2,030 2,010 2,000 1,870 1,900 Million meat lbs. 1,900 1,800 1,890 1,700 1,640 1,600 1,630 1,500 1,410 1,400 1,390 1,300 1,200 1,120 1,100 1,000 915 Final Forecast 900 800 2005 2006 2007 2008 2009 2010 2011 2012 2013 2014 2015 2016 2017 Year
Almond Set 2016 – 2018 Average nuts per tree 2016 2017 2018 % Change California 6,159 5,714 5,677 -.6%
ALMONDS Nuts per Tree, by District 9,000 Sacramento Valley San Joaquin Valley State 8,000 7,651 7,561 7,000 7,322 7,353 7,041 7,100 7,048 6,802 6,686 6,538 6,646 6,000 6,163 6,114 6,127 6,159 5,874 5,829 5,714 5,735 5,783 5,583 5,677 5,536 5,000 5,015 4,000 3,000 2011 2012 2013 2014 2015 2016 2017 2018
Almond Set per Tree by Variety, 2016-2018 % 2016 2017 2018 Change Butte -8.9 7,051 6,574 5,989 California Types + 21.8 6,114 5,216 6,354 Carmel + 16.4 5,849 5,456 6,353 Monterey + 15.2 5,739 4,655 5,362 Nonpareil -13.9 5,583 5,717 4,924 Padre -6.1 7,788 7,168 6,732
NONPAREIL TYPE Nuts per Tree 9,000 8,000 7,482 7,000 6,571 6,141 6,121 5,717 6,000 5,583 5,239 4,924 5,000 4,000 3,000 2011 2012 2013 2014 2015 2016 2017 2018
CALIFORNIA TYPE Nuts per Tree 9,000 8,000 6,845 6,744 7,000 6,718 6,535 6,354 6,114 5,737 6,000 5,216 5,000 4,000 3,000 2011 2012 2013 2014 2015 2016 2017 2018
Average Nut Weight (grams) vs. Yield 2.00 2,800 1.79 1.80 2,600 1.72 1.67 1.58 1.57 1.57 1.60 1.54 2,400 1.49 1.48 1.48 1.47 1.45 1.45 1.43 1.43 1.36 1.40 2,200 1.20 Grams Lbs. per Acre 2,000 1.00 1,800 0.80 1,600 0.60 1,400 0.40 0.20 1,200 Series1 Series2 2003 2004 2005 2006 2007 2008 2009 2010 2011 2012 2013 2014 2015 2016 2017 2018
ALMONDS Kernel Width, mm 14.0 13.35 13.5 13.30 13.10 13.20 Millimeters 12.91 12.83 12.79 13.0 12.69 12.58 12.52 12.51 12.44 12.39 12.30 12.34 12.5 12.11 12.0 11.5 2003 2004 2005 2006 2007 2008 2009 2010 2011 2012 2013 2014 2015 2016 2017 2018 Year ALMONDS Kernel Thickness, mm 11.0 10.47 10.45 10.40 10.37 10.5 10.31 10.30 Millimeters 10.06 9.96 9.94 9.93 9.93 9.92 9.89 10.0 9.76 9.72 9.66 9.5 9.0 2003 2004 2005 2006 2007 2008 2009 2010 2011 2012 2013 2014 2015 2016 2017 2018 Year
CALIFORNIA ALMONDS Kernel Length, mm 25.0 23.73 24.0 23.38 22.96 Millimeters 23.0 22.50 22.24 22.44 22.09 21.84 21.64 21.81 21.60 22.0 21.40 21.35 21.42 21.43 21.32 21.0 20.0 2003 2004 2005 2006 2007 2008 2009 2010 2011 2012 2013 2014 2015 2016 2017 2018 Year ALMONDS PERCENT SOUND NUTS 2001-2016 101.0 100.0 99.1 99.0 98.9 98.9 98.8 98.8 98.8 98.7 98.7 98.7 99.0 98.5 98.4 98.3 Percent 97.7 97.6 98.0 97.3 97.0 96.0 95.0 Year
Forecast and all Statistics Available On-line PRO Web: www.nass.usda.gov/ca NASS Web: www.nass.usda.gov PRO Contact: (916) 738-6600
2018 OM Almond Forecast 2.45 Billion Meat Pounds (+ 7.9 Percent) Bearing Acres: 1,070,000 (Trees Planted 2015 and earlier) Yield: 2,290 Pounds (+.9% Percent)
Thank you to the producers who allowed us to conduct this survey in their orchards.
Recommend
More recommend