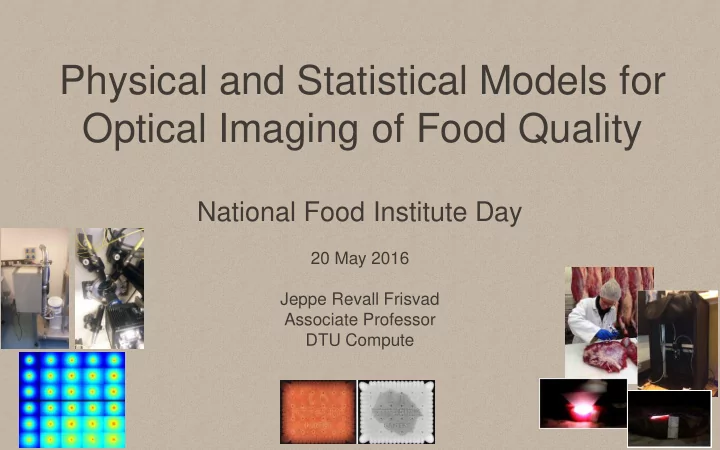

Physical and Statistical Models for Optical Imaging of Food Quality National Food Institute Day 20 May 2016 Jeppe Revall Frisvad Associate Professor DTU Compute
Why inspect food quality? • Consumers expect – Large diversity of food products – Uniformly high quality http://niemagazine.com/consumers-dictate-natural-sensory-qualities/ – Fulfillment of both culinary and nutritional demands – Highest food safety standards • We need efficient quality assessment and inline process control.
Why optical imaging? • Food appearance carries information on – Size, shape, and color (obviously) – Organoleptic parameters (flavor, taste) – Texture, stability, and mouthfeel – Moisture content and storability – Ingredients: amounts of constituents • Computer vision sensors enable noninvasive inline monitoring of food appearance.
Optical imaging methods • Multispectral imaging example Transmission filters Controled illumination VidemeterLab • Hyperspectral imaging example Static Light Scattering (SLS) instrument Pushbroom Acousto-Optic Tuneable Filter (AOTF)
Optical imaging methods • Grating-based X-ray imaging
Multispectral imaging ultraviolet near-infrared (UV) (NIR) nm 200 300 400 500 600 700 800 900 1000 N images obtained at N specific wavelengths
Example: biscuit quality a. Biscuit with water drop in the centre (sRGB) b. Spectrally extracted water absorption map a. c. b. c. Predicted %Moisture from 8 spectral image features versus the %Moisture from evaporation device.
Example: biscuit quality • Normalized canonical discriminant analysis for measuring yellow/red – higher browning – browning index bluish – conforming – glazing vs. non-glazing darker gray – glazing lighter gray – non-glazing
Example: meat study with DMRI Minolta colorimeter VideometerLab Meat Raw samples Cooked
Example: meat study with DMRI • Both instruments discriminate between raw and cooked meat. • Problems in using a colorimeter: – Integrates over large surface patch (misses variations). – Light penetration depth too large (not good for bright red meat at early days of display). – No spectroscopy. • Computer vision systems colorimeter projector solve these problems.
Example: Salami study with DuPont • Salami fermentation process after production. Days: 2 3 9 Segmentation of background and of meat from fat 42 Days: 14 21
Example: Salami study with DuPont • Statistical meat color scale – Darker blue is fresh meat – Yellow and orange represent fermented meat Significant color Days: 2 42 difference between chilled and non-chilled.
Hyperspectral imaging sample image lab setup in situ setup (log transformed, false colours) Milk (1.5% ), at 900 nm
Example: milk fermentation • Spectroscopy for measuring scattering and absorption properties. infer optical properties reduced scattering [1/cm] absorption [1/cm] extract profile yogurt spectroscopy milk oblique incidence wavelength [nm] wavelength [nm] reflectometry
Example: milk fermentation Statistical profile analysis Physical model for particle sizing for estimating viscosity based on optical properties
Grating-based X-ray imaging • When we need to investigate subsurface features. • Three contrast mechanisms are used in grating-based imaging:
Example: heated meat products • Evaluating heat induced changes of micro- structure and cooking loss. Beef Meat emulsion Raw Boiled Lard Sunflower oil
Example: detecting foreign objects Combined multimodal intensity and texture features give best detection results. Normal food model 1 2 3 4 5 6 7 8 Absorption Phase contrast Dark field 1 2 3 4 5 6 7 8 Detection rates
Conclusion • Optical imaging is very useful when moving toward more and better automation in food quality control. • Choice of instrument is important: – VideometerLab is good for detecting spectroscopic differences between different sample regions. – Static light scattering (SLS) is good for detecting emulsion differences in seemingly similar substances. – Grating-based X-ray imaging is good for detecting foreign objects or subsurface/volumetric features.
Credits • Camilla Himmelstrup Trinderup (postdoc, DTU Compute) • Otto Højager Attermann Abildgaard (PhD, DTU Compute Alumnus) • Hildur Einarsdóttir (PhD student, DTU Compute) • Jens Michael Carstensen (Associate Professor, DTU Compute) • Line Harder Clemmensen (Associate Professor, DTU Compute) • Jacob Lercke Skytte (postdoc, DTU Food) • Sara Sharifzadeh (PhD, DTU Compute Alumna) • Knut Conradsen (Professor, DTU Compute) • Anders Bjorholm Dahl (Head of Image Section, DTU Compute) • Bjarne Ersbøll (Head of Statistics Section, DTU Compute) • Rasmus Larsen (Head of Department, DTU Compute) • Research projects: CIFQ and NEXIM
Thank you for your attention • Computing milk appearance using light scattering by fat and protein particles. water vitamin B2 casein milk fat skimmed reduced fat whole products constituents
Recommend
More recommend