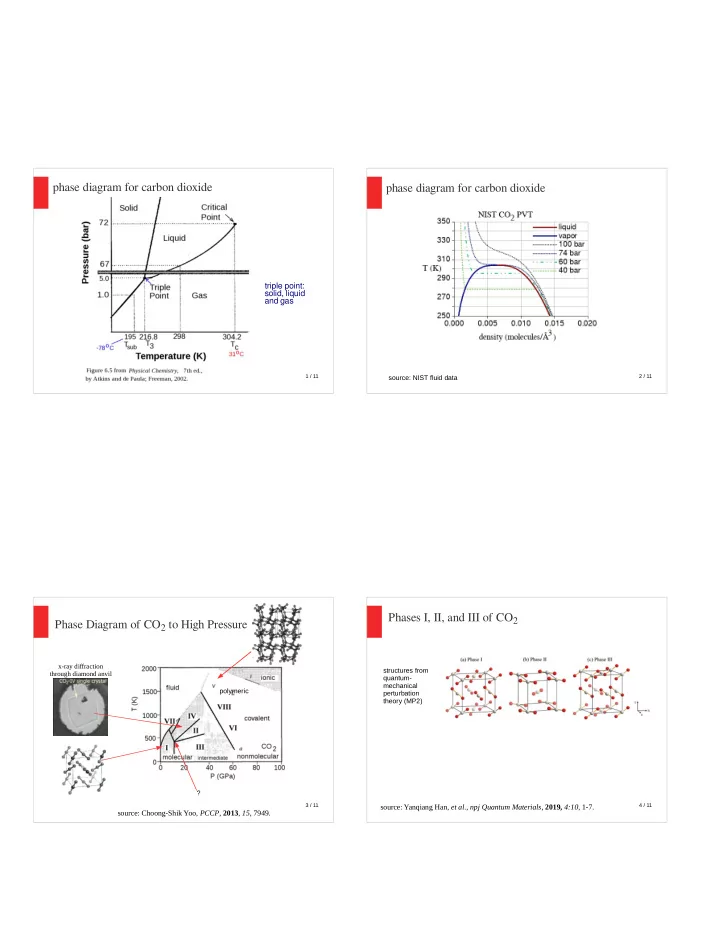

phase diagram for carbon dioxide phase diagram for carbon dioxide triple point: solid, liquid and gas 1 / 11 source: NIST fluid data 2 / 11 Phases I, II, and III of CO 2 Phase Diagram of CO 2 to High Pressure x-ray diffraction structures from through diamond anvil quantum- mechanical polymeric perturbation theory (MP2) ? 3 / 11 4 / 11 source: Yanqiang Han, et al ., npj Quantum Materials , 2019, 4:10 , 1-7. source: Choong-Shik Yoo, PCCP , 2013 , 15 , 7949.
Phases I, II, and III of CO 2 Phases I, II, and III of CO 2 Han's new points are in red and blue. Main conclusion: There is a phase II-III boundary. II and III I and III P(GPa) T(K) P(GPa) T(K) source: Yanqiang 12 524 13.8 98 Han, et al ., npj 13 531 13.4 198 Quantum 14 543 12.6 298 Materials , 2019, 5 / 11 source: Yanqiang Han, et al ., npj Quantum Materials , 2019, 4:10 , 1-7. 6 / 11 15 554 11.6 398 4:10 , 1-7. 3 He and 4 He phase diagrams helium-4 nuclear spin = 0 1 MPa = 10 bar abundance 99.9998% helium-3 nuclear spin = ½ I II solid has λ line standard higher boiling entropy point source: Aalto University School of Science, Finland 8 / 11 http://ltl.tkk.fi/research/theory/helium.html
metallic hydrogen observed? diamond-anvil cell Experiments by Isaac Silvera and Ranga Dias at Harvard. Hydrogen became "shiny and reddish." Metallic character identified by Raman scattering. As of 2018 Silvera and Dias stand by their conclusions. Neil Ashcroft: "very convincing" Eugene Gregoryanz, "the word garbage cannot really describe it." source: Robert Service, "Metallic hydrogen created in diamond vise," Science , 9 / 11 10 / 11 355 (6323), 332-333, 27 January 2017. metallic hydrogen observed? T = 5K source: Ranga Dias and Isaac Silvera, "Observation of the Wigner-Huntington transition to metallic hydrogen," Science , 355 (6326), 715-718, 11 / 11 2017.
Recommend
More recommend