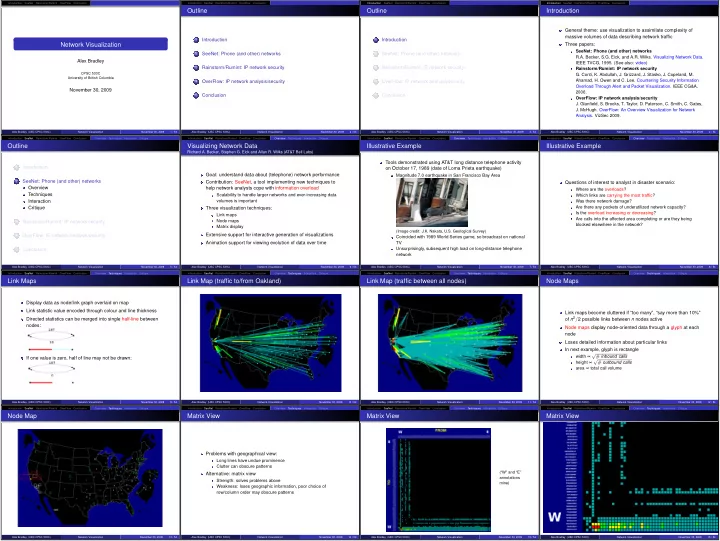

Introduction SeeNet Rainstorm/Rumint OverFlow Conclusion Introduction SeeNet Rainstorm/Rumint OverFlow Conclusion Introduction SeeNet Rainstorm/Rumint OverFlow Conclusion Introduction SeeNet Rainstorm/Rumint OverFlow Conclusion Outline Outline Introduction General theme: use visualization to assimilate complexity of massive volumes of data describing network traffic 1 Introduction 1 Introduction Network Visualization Three papers: SeeNet: Phone (and other) networks 2 SeeNet: Phone (and other) networks 2 SeeNet: Phone (and other) networks R.A. Becker, S.G. Eick, and A.R. Wilks. Visualizing Network Data. Alex Bradley IEEE TVCG, 1995. (See also: video) 3 Rainstorm/Rumint: IP network security 3 Rainstorm/Rumint: IP network security Rainstorm/Rumint: IP network security CPSC 533C G. Conti, K. Abdullah, J. Grizzard, J. Stasko, J. Copeland, M. University of British Columbia Ahamad, H. Owen and C. Lee. Countering Security Information 4 OverFlow: IP network analysis/security 4 OverFlow: IP network analysis/security Overload Through Alert and Packet Visualization. IEEE CG&A, November 30, 2009 2006. 5 Conclusion 5 Conclusion OverFlow: IP network analysis/security J. Glanfield, S. Brooks, T. Taylor, D. Paterson, C. Smith, C. Gates, J. McHugh. OverFlow: An Overview Visualization for Network Analysis. VizSec 2009. Alex Bradley (UBC CPSC 533C) Network Visualization November 30, 2009 1 / 54 Alex Bradley (UBC CPSC 533C) Network Visualization November 30, 2009 2 / 54 Alex Bradley (UBC CPSC 533C) Network Visualization November 30, 2009 3 / 54 Alex Bradley (UBC CPSC 533C) Network Visualization November 30, 2009 4 / 54 Introduction SeeNet Rainstorm/Rumint OverFlow Conclusion Overview Techniques Interaction Critique Introduction SeeNet Rainstorm/Rumint OverFlow Conclusion Overview Techniques Interaction Critique Introduction SeeNet Rainstorm/Rumint OverFlow Conclusion Overview Techniques Interaction Critique Introduction SeeNet Rainstorm/Rumint OverFlow Conclusion Overview Techniques Interaction Critique Outline Visualizing Network Data Illustrative Example Illustrative Example Richard A. Becker, Stephen G. Eick and Allan R. Wilks (AT&T Bell Labs) Tools demonstrated using AT&T long distance telephone activity 1 Introduction on October 17, 1989 (date of Loma Prieta earthquake) Goal: understand data about (telephone) network performance Magnitude 7.0 earthquake in San Francisco Bay Area 2 SeeNet: Phone (and other) networks Contribution: SeeNet, a tool implementing new techniques to Questions of interest to analyst in disaster scenario: Overview help network analysts cope with information overload Where are the overloads? Techniques Scalability to handle larger networks and ever-increasing data Which links are carrying the most traffic? Interaction volumes is important Was there network damage? Critique Three visualization techniques: Are there any pockets of underutilized network capacity? Is the overload increasing or decreasing? Link maps Are calls into the affected area completing or are they being 3 Rainstorm/Rumint: IP network security Node maps blocked elsewhere in the network? Matrix display (Image credit: J.K. Nakata, U.S. Geological Survey) 4 OverFlow: IP network analysis/security Extensive support for interactive generation of visualizations Coincided with 1989 World Series game, so broadcast on national Animation support for viewing evolution of data over time TV 5 Conclusion Unsurprisingly, subsequent high load on long-distance telephone network Alex Bradley (UBC CPSC 533C) Network Visualization November 30, 2009 5 / 54 Alex Bradley (UBC CPSC 533C) Network Visualization November 30, 2009 6 / 54 Alex Bradley (UBC CPSC 533C) Network Visualization November 30, 2009 7 / 54 Alex Bradley (UBC CPSC 533C) Network Visualization November 30, 2009 8 / 54 Introduction SeeNet Rainstorm/Rumint OverFlow Conclusion Overview Techniques Interaction Critique Introduction SeeNet Rainstorm/Rumint OverFlow Conclusion Overview Techniques Interaction Critique Introduction SeeNet Rainstorm/Rumint OverFlow Conclusion Overview Techniques Interaction Critique Introduction SeeNet Rainstorm/Rumint OverFlow Conclusion Overview Techniques Interaction Critique Link Maps Link Map (traffic to/from Oakland) Link Map (traffic between all nodes) Node Maps Display data as node/link graph overlaid on map Link statistic value encoded through colour and line thickness Link maps become cluttered if “too many”, “say more than 10%” Directed statistics can be merged into single half-line between of n 2 / 2 possible links between n nodes active nodes: Node maps display node-oriented data through a glyph at each node Loses detailed information about particular links In next example, glyph is rectangle width ∝ √ # inbound calls If one value is zero, half of line may not be drawn: height ∝ √ # outbound calls area ∝ total call volume Alex Bradley (UBC CPSC 533C) Network Visualization November 30, 2009 9 / 54 Alex Bradley (UBC CPSC 533C) Network Visualization November 30, 2009 10 / 54 Alex Bradley (UBC CPSC 533C) Network Visualization November 30, 2009 11 / 54 Alex Bradley (UBC CPSC 533C) Network Visualization November 30, 2009 12 / 54 Introduction SeeNet Rainstorm/Rumint OverFlow Conclusion Overview Techniques Interaction Critique Introduction SeeNet Rainstorm/Rumint OverFlow Conclusion Overview Techniques Interaction Critique Introduction SeeNet Rainstorm/Rumint OverFlow Conclusion Overview Techniques Interaction Critique Introduction SeeNet Rainstorm/Rumint OverFlow Conclusion Overview Techniques Interaction Critique Node Map Matrix View Matrix View Matrix View Problems with geographical view: Long lines have undue prominence Clutter can obscure patterns Alternative: matrix view (“W” and “E” annotations Strength: solves problems above mine) Weakness: loses geographic information, poor choice of row/column order may obscure patterns Alex Bradley (UBC CPSC 533C) Network Visualization November 30, 2009 13 / 54 Alex Bradley (UBC CPSC 533C) Network Visualization November 30, 2009 14 / 54 Alex Bradley (UBC CPSC 533C) Network Visualization November 30, 2009 15 / 54 Alex Bradley (UBC CPSC 533C) Network Visualization November 30, 2009 15 / 54
Recommend
More recommend