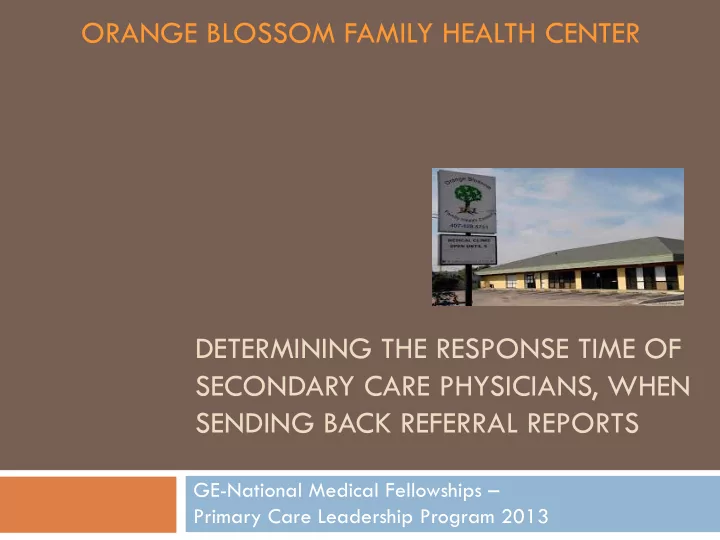

ORANGE BLOSSOM FAMILY HEALTH CENTER DETERMINING THE RESPONSE TIME OF SECONDARY CARE PHYSICIANS, WHEN SENDING BACK REFERRAL REPORTS GE-National Medical Fellowships – Primary Care Leadership Program 2013
Background Primary Care Demographic 50% of physicians during WWII Less than 30% of physicians today Over the past 10 years do you think that communication between GPs and consultants has:
Background From your experience, is patient care suffering due to communication difficulties between primary and secondary care? “In each country, only a minority of primary care doctors reported always receiving timely information from specialists to whom they have referred patients” ( Schoen, C. & Osborn, R., 2013).
Goal Create a qualitative and quantitative analysis of the response time of secondary care physicians, when sending back referral reports to the primary care staff at the Orange Blossom Family Health Center.
Methodology A report containing the total amount of referrals was acquired via the Electronic Health Records system (EHR). Sample from August 2012 – March 2013
Methodology Using the EHR system Search for patient using their name and referral date Patient’s actual referral can be found under the “order tab ” Verify the appointment date under the “appointments tab” Go to the “imaging tab” to search for the following information. Secondary Care Physician Appointment Appointment Completed Date Date Primary Care Receives Report
Tools Company computer with access to the Electronic Health Records EHR Referral report
Data Statistics n 373 Results Mean Age 51.32 Standard Deviation (Age) 11.95 Min Age 19 Max Age 88 Gender 142 231 Male Female Insured vs. Uninsured Paitients Race 5 71 Asian 2 9 Black 147 226 Insured Hispanic Uninsured Indian 209 76 Other White
Results Continued Data Results Total Number of Mental & HOPE Not Completed Completed Patients Team 373 271 76 26 26 76 Not Completed 271 Completed Mental & HOPE Team
Results Continued Number of Completed Referrals Within 60 After 60 Average Days 58 18 46 18 Within 60 Days 58 After 60 Days
Results Continued Referrals that were Not Completed DNKA DNQ Refused Patient has not been back Reason Unknown Service since initial appointment 17 28 1 24 201 6.3% 10.3% 0.4% 8.9% DNKA DNQ 74.2% Refused Service Pt hasn't been back Reason Unknown
Results Continued Insured vs. Uninsured Patients Total Number of Patients Not Completed Completed Mental & HOPE Team Insured 147 117 24 6 Uninsured 226 159 52 15 Insured vs. Uninsured Uninsured 159 52 15 Not Completed Completed Mental Insured 117 24 6 0 50 100 150 200 250
Results Continued Insured vs. Uninsured Patients Total Number of Patients Not Completed Completed Mental & HOPE Team Insured 147 117 24 6 Uninsured 226 159 52 15 Insured vs. Uninsured 90.0% 80.0% 70.0% 60.0% Not Completed 50.0% Completed 40.0% 79.6% 70.4% Mental 30.0% 20.0% 23.0% 10.0% 16.3% 10.2% 6.6% 0.0% Insured Uninsured
Results Continued Insured vs. Uninsured Patients Completed Referrals Number of Referrals Number of Referrals Average Number of Days it Within 60 Days After 60 Days took to Complete a Referral Insured 22 2 38 Uninsured 36 16 49 Insured vs. Uninsured Completed Referrals 60 50 40 Within 60 Days 30 After 60 Days 49 20 Average # of Days 38 36 22 10 16 2 0 Insured Uninsured
Results Continued Insured vs. Uninsured Patients Completed Referrals Number of Referrals Number of Referrals Average Number of Days it Within 60 Days After 60 Days took to Complete a Referral Insured 22 2 38 Uninsured 36 16 49 Insured vs. Uninsured Completed Referrals 100.0% 90.0% 80.0% 70.0% 60.0% Within 60 Days 50.0% 91.7% After 60 Days 40.0% 69.2% 30.0% 20.0% 30.8% 10.0% 8.3% 0.0% Insured Uninsured
Discussion The Numbers 271 had uncompleted referrals (73%) 76 had completed referrals (20%) 26 were patients (7%) referred for psychiatric reasons or to the HOPE Team The data showed an increased percentage of the uninsured population having their referrals completed (23% vs. 16.3%). Problem Area Lack of standardization Lack of referral tracking Communication between all parties in the referral process
Conclusion In conclusion, it appears that no definitive assessment can be made about the referral process until the tracking and standardization portion has been addressed. At this time, there are too many variables in play to make an accurate assessment on the referral process between insured vs. uninsured patients, and whether or not secondary care physician are returning referrals in a timely manner.
Recommendations The center should use the datasheet as a good starting point to create a comprehensive referral list. Standardize the incoming documentation process
Acknowledgements The entire Orange Blossom Family Health Center Dr. Leonardo Oliveira GE-NMF Primary Care Leadership Program
Recommend
More recommend