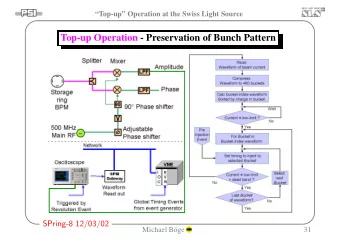
Operation and results of spectrophotometric measurements with a high temporal resolution at the observatory of IMCES Smirnov S. V. Institute of Monitoring of Climatic and Ecological Systems SB RAS, Tomsk ENVIROMIS-2008, June 28 - July 5, 2008, Tomsk, Russia
Background Ozone and UV solar radiation are a key atmospheric constituents in atmospheric chemistry. In the stratosphere ozone acts as an absorber of UV radiation, providing a UV shield for the Earth, as well as an energy source. UV radiation in turn is an important parameter in atmospheric chemistry and plays a key role in environmental and climatic problems associated with tropospheric chemistry and air quality, stratospheric chemistry and ozone depletion, bioproductivity and human health, and chemistry-climate interactions. ENVIROMIS-2008, June 28 - July 5, 2008, Tomsk, Russia
Main Research Needs Global Monitoring for Environment and Security (GMES) PROtocol MOniToring for the GMES Service Element: Atmosphere (PROMOTE) Science Review for Ozone, UV, Air Quality, Greenhouse Gases and Aerosol, 2006 n Both monitoring and forecasting of UV irradiance and spectral fluxes on a surface, there is in urgent need of improved data that adequately take into account UV attenuation by clouds and aerosols. n Although cloud effects are understood theoretically, the quality of forecasting and monitoring is still limited by uncertainties of input parameters. This is especially caused by the spatio- temporal variability and inhomogeneity of clouds, as well as the complex radiative interaction of UV radiation between clouds, aerosol, surface, phytome and the human skin. ENVIROMIS-2008, June 28 - July 5, 2008, Tomsk, Russia
Approach n To operate spectrophotometric UV observations with a high ⇒ temporal resolution to minimize uncertainties in observational data, as well as to analyze the short-term and fast UV variations (oscillations) n To perform UV observations in complex with other atmospheric observations including meteorological, actinometrical and electrical measurements ⇒ to analyze the interaction of UV radiation with different atmospheric parameters The investigations are carried out within the framework of project SB RAS # 7.10.1.1 «Investigation of atmospheric processes forming the climate with allowance for global and regional climatic effects». ENVIROMIS-2008, June 28 - July 5, 2008, Tomsk, Russia
Location Measurements of solar UV radiation are performed at the observatory (56.48°N, 85.05°E, 193 m a. s. l.) of IMCES SB RAS since March, 2006 with multichannel moderate-bandwidth filter NILU-UV-6T radiometer # 04117. ENVIROMIS-2008, June 28 - July 5, 2008, Tomsk, Russia
Instrument 1/ 2 The radiometer measures UV irradiances at five channels with center wavelengths at 302, 312, 320, 340 and 380 nm. The channel bandwidths are approximately 10 nm at FWHM. In addition, a sixth channel measures photosynthetic active radiation (PAR) in the wavelength region 400 − 700 nm. The optical part of the instrument consists of a Teflon diffuser, silicon detectors and high quality band-pass filters. ENVIROMIS-2008, June 28 - July 5, 2008, Tomsk, Russia
Instrument 2/ 2 The instrument has a built-in circular data logger with capacity of storing 3 weeks of one-minute averages of the measured irradiances and the detector temperature. A data acquisition software transfers measured raw data to the computer hard disk and can display on-line raw data as well as historical raw data. A data processing software calculates the mean and maximum dose rates and integrated daily dose of UV-A (315-400 nm), UV- B (280-315 nm), FAR, С IE- and CLW-weighted irradiance. The software also provides cloud cover assessment and total ozone column. Besides absolute calibrations performed by the NILU, the instrument is calibrated with lamp calibrator on a regular basis in place. ENVIROMIS-2008, June 28 - July 5, 2008, Tomsk, Russia
Measurement Results 1/ 12 100 2006 Mean daily cloud transmission at 380 nm [%] 2007 2008 80 60 40 20 0 1 31 61 91 121 151 181 211 241 271 301 331 361 Day of year from March 27, 2006 to June 21, 2008 ENVIROMIS-2008, June 28 - July 5, 2008, Tomsk, Russia
Measurement Results 2/ 12 550 Mean daily total ozone [DU] 2006 500 2007 2008 450 400 350 300 250 200 8 SD [DU] 6 4 2 0 1 31 61 91 121 151 181 211 241 271 301 331 361 Day of year from March 27, 2006 to June 21, 2008 ENVIROMIS-2008, June 28 - July 5, 2008, Tomsk, Russia
Measurement Results 3/ 12 6 1,6x10 2006 Integrated daily dose of UV-A [J/m^2] 2007 6 1,4x10 2008 6 1,2x10 6 1,0x10 5 8,0x10 5 6,0x10 5 4,0x10 5 2,0x10 0,0 1 31 61 91 121 151 181 211 241 271 301 331 361 Day of year from March 27, 2006 to June 21, 2008 ENVIROMIS-2008, June 28 - July 5, 2008, Tomsk, Russia
Measurement Results 4/ 12 50 2006 Mean daily dose rate of UV-A [W/m^2] 2007 2008 40 30 20 10 0 1 31 61 91 121 151 181 211 241 271 301 331 361 Day of year from March 27, 2006 to June 21, 2008 ENVIROMIS-2008, June 28 - July 5, 2008, Tomsk, Russia
Measurement Results 5/ 12 2006 Integrated daily dose of UV-B [J/m^2] 4 8,0x10 2007 2008 4 6,0x10 4 4,0x10 4 2,0x10 1 31 61 91 121 151 181 211 241 271 301 331 361 Day of year from March 27, 2006 to June 21, 2008 ENVIROMIS-2008, June 28 - July 5, 2008, Tomsk, Russia
Measurement Results 6/ 12 3,5 2006 Mean daily dose rate of UV-B [W/m^2] 2007 3,0 2008 2,5 2,0 1,5 1,0 0,5 0,0 1 31 61 91 121 151 181 211 241 271 301 331 361 Day of year from March 27, 2006 to June 21, 2008 ENVIROMIS-2008, June 28 - July 5, 2008, Tomsk, Russia
Action spectrum used for convertation the PAR units from µ W/(cm ² ⋅ nm) to µ E/(cm ² ⋅ s) -6 6,0x10 -6 5,0x10 Coefficient -6 4,0x10 -6 3,0x10 -6 2,0x10 400 450 500 550 600 650 700 Wavelength [nm] From: http://www.biospherical.com/nsf/login/GUV/PAR_convert_uW_per_cm2nm_to_uE_per_cm2sec.txt ENVIROMIS-2008, June 28 - July 5, 2008, Tomsk, Russia
Measurement Results 7/ 12 7 5x10 2006 Integreted daily dose of PAR [ µ E/m^2] 2007 2008 7 4x10 7 3x10 7 2x10 7 1x10 0 1 31 61 91 121 151 181 211 241 271 301 331 361 Day of year from March 27, 2006 to June 21, 2008 ENVIROMIS-2008, June 28 - July 5, 2008, Tomsk, Russia
Measurement Results 8/ 12 1600 2006 Mean daily dose rate of PAR [ µ E/(s ⋅ m^2)] 2007 1400 2008 1200 1000 800 600 400 200 0 1 31 61 91 121 151 181 211 241 271 301 331 361 Day of year from March 27, 2006 to June 21, 2008 ENVIROMIS-2008, June 28 - July 5, 2008, Tomsk, Russia
Generalized plant (biological) action spectrum 0,7 0,6 Action spectrum suggested by: Caldwell, M. M. (1971). Solar UV irradiation and the growth and development of Relative Effectiveness 0,5 higher plants // In: Photophysiology, edited by A.C. Giese, Vol. 6, Ch. 4, pp. 131 - 177 0,4 Spectrum was parameterized based on Equation (24) in: Green, A. E. S., T. Sawada, and E. P. Shettle (1974). The middle ultraviolet reaching the ground // Photochemistry and Photobiology, Vol 19., pp. 251-259: 0,3 A = 2.618*(1-(w/313.3)^2)*exp((300-w)/31.08), where w is wavelength in nm. Caldwell defines the action spectrum as "relative photon effectiveness". 0,2 The spectrum is used "as is", without converting it to energy units. Dose rates derived with this action spectrum are labeled "Caldwell". 0,1 Integration range: 286 - 313 nm 0,0 285 290 295 300 305 310 315 Wavelength [nm] From: http://www.biospherical.com/nsf/login/GUV/Caldwell.txt ENVIROMIS-2008, June 28 - July 5, 2008, Tomsk, Russia
Measurement Results 9/ 12 Integrated daily dose of CLW-weighted UV [J/m^2] 2006 3 5x10 2007 2008 3 4x10 3 3x10 3 2x10 3 1x10 0 1 31 61 91 121 151 181 211 241 271 301 331 361 Day of year from March 27, 2006 to June 21, 2008 ENVIROMIS-2008, June 28 - July 5, 2008, Tomsk, Russia
Measurement Results 10/ 12 Mean daily dose rate of CLW-weighted UV [W/m^2] 0,25 2006 2007 2008 0,20 0,15 0,10 0,05 0,00 1 31 61 91 121 151 181 211 241 271 301 331 361 Day of year from March 27, 2006 to June 21, 2008 ENVIROMIS-2008, June 28 - July 5, 2008, Tomsk, Russia
CIE-weighted irradiance is the erythemally effective UV radiation. Of the global UV radiation at the ground, 94% is UV-A, 6% is UV-B. Of the erythemal UV irradiance, however, 17% is UV-A, 83% is UV-B. The CIE action spectrum is a model for the susceptibility of the Caucasian skin to sunburn (reddening of the skin; erythema). It was proposed by McKinlay & Diffey (1987) and adopted as a de l' É clairage standard by the Commission Internationale (International Commission on Illumination). ENVIROMIS-2008, June 28 - July 5, 2008, Tomsk, Russia
Measurement Results 11/ 12 Integrated daily dose of CIE-weighted UV [J/m^2] 2006 2007 3 4x10 2008 3 3x10 3 2x10 3 1x10 0 1 31 61 91 121 151 181 211 241 271 301 331 361 Day of year from March 27, 2006 to June 21, 2008 ENVIROMIS-2008, June 28 - July 5, 2008, Tomsk, Russia
Measurement Results 12/ 12 Mean daily dose rate of CIE-weighted UV [W/m^2] 2006 0,20 2007 2008 0,15 0,10 0,05 0,00 1 31 61 91 121 151 181 211 241 271 301 331 361 Day of year from March 27, 2006 to June 21, 2008 ENVIROMIS-2008, June 28 - July 5, 2008, Tomsk, Russia
Recommend
More recommend
Unleash a World of Digital Possibilities—Browse, Share, and Explore Content Without Boundaries