SLIDE 46 We are mapping a full 3D distribution of galaxies ⨉ the intergalactic medium (using “Lyα in emission and absorption”) to understand the Epoch of Reionization.
Summary “Lyα probing Lyα”
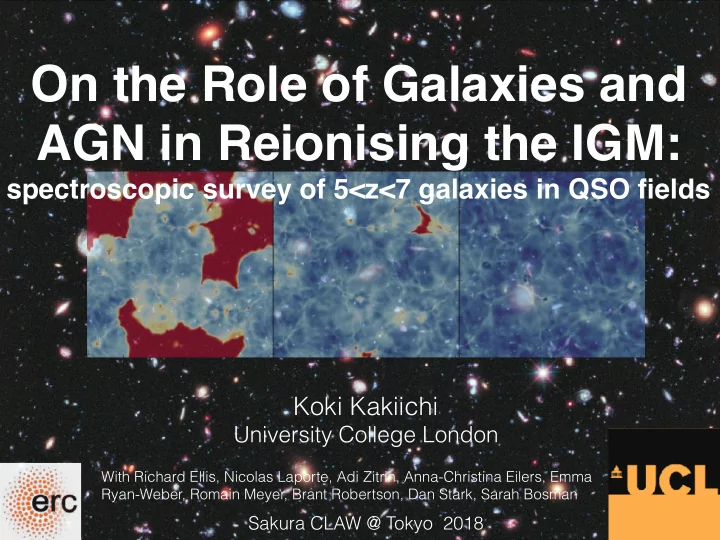
What reionised the Universe?
Becker+
QSO absorption spectra Galaxy spectra Spectroscopic survey of Lyα emitting galaxies in QSO fields Post-reionized IGM
HI HII
Lyα
QSO
z>6
Ly𝛃 halo
CGM small-scale absorbers
“While faint galaxies (Muv<-15) with high escape fraction (>10%) primarily drive reionization, luminous galaxies and AGN may play an increasingly important role in sourcing the large-scale fluctuations of the UV background and thermal state of the IGM towards the tail end of reionisation”
1) A new route to escape fraction. 2) Role of luminous galaxies and AGN. 3) … more!
Kakiichi+2018 (arXiv:1803.02981)