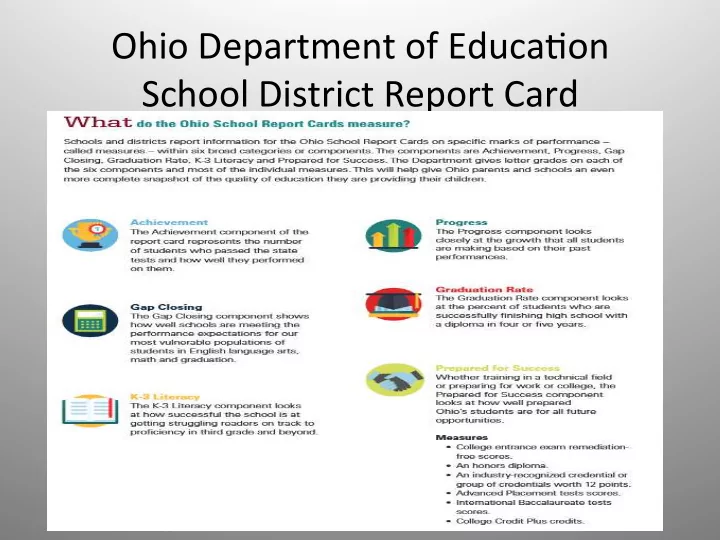

Ohio ¡Department ¡of ¡Educa3on ¡ School ¡District ¡Report ¡Card ¡
PCSD ¡Report ¡Card ¡2016-‑2017 ¡
Achievement ¡Component ¡ 90 ¡ Comparison ¡of ¡Elementary ¡Indicators ¡ 80 ¡ 70 ¡ 60 ¡ 50 ¡ 40 ¡ 30 ¡ 20 ¡ 10 ¡ 0 ¡ ¡3rd ¡Grade ¡ELA ¡ 3rd ¡Grade ¡Math ¡ 4th ¡Grade ¡ELA ¡ 4th ¡Grade ¡Math ¡ 4th ¡Grade ¡SS ¡ 2015-‑16 ¡ 63.2 ¡ 71.1 ¡ 52.8 ¡ 66.9 ¡ 70.3 ¡ 2016-‑17 ¡ 62.5 ¡ 67.1 ¡ 73.1 ¡ 79.1 ¡ 83.1 ¡ 2015-‑16 ¡ 2016-‑17 ¡ State ¡ State ¡ 63.7 ¡ 70.7 ¡ 62.8 ¡ 72.4 ¡ 77.5 ¡
Achievement ¡Component ¡ Comparison ¡of ¡Middle ¡School ¡Indicators ¡ 80 ¡ 70 ¡ 60 ¡ 50 ¡ 40 ¡ 30 ¡ 20 ¡ 10 ¡ 0 ¡ Grade ¡5 ¡ Grade ¡6 ¡ Grade ¡7 ¡ Grade ¡5 ¡ELA ¡ Grade ¡5 ¡SC ¡ Grade ¡6 ¡ELA ¡ Grade ¡6 ¡SS ¡ Grade ¡7 ¡ELA ¡ Math ¡ Math ¡ Math ¡ 2015-‑16 ¡ 59.3 ¡ 66.7 ¡ 74.3 ¡ 50 ¡ 47.3 ¡ 53.6 ¡ 49 ¡ 57.2 ¡ 2016-‑17 ¡ 65.7 ¡ 63.8 ¡ 70.9 ¡ 58.2 ¡ 52.8 ¡ 60.7 ¡ 57.4 ¡ 45.5 ¡ State ¡ 67.7 ¡ 61.6 ¡ 68.3 ¡ 60.2 ¡ 60.2 ¡ 64 ¡ 59.2 ¡ 56.1 ¡ 2015-‑16 ¡ 2016-‑17 ¡ State ¡
Achievement ¡Component ¡ Comparison ¡of ¡High ¡School ¡Indicators ¡ 80 ¡ 70 ¡ 60 ¡ 50 ¡ 40 ¡ 30 ¡ 20 ¡ 10 ¡ 0 ¡ Grade ¡8 ¡ Grade ¡8 ¡ Grade ¡8 ¡Sc ¡ Algebra ¡I ¡ Geometry ¡ ELA ¡I ¡ ELAII ¡ US ¡History ¡ Gov't ¡ Bio ¡ ELA ¡ Math ¡ 2015-‑16 ¡ 47.4 ¡ 43.2 ¡ 69.6 ¡ 49 ¡ 54.7 ¡ 57 ¡ 54.5 ¡ 69.5 ¡ 61.3 ¡ 56.3 ¡ 2016-‑17 ¡ 47.5 ¡ 51.7 ¡ 63.1 ¡ 44.2 ¡ 37.6 ¡ 56.6 ¡ 53.8 ¡ 63.7 ¡ 69.4 ¡ 51.9 ¡ State ¡ 50.3 ¡ 54.9 ¡ 65.8 ¡ 56.2 ¡ 49.7 ¡ 69.2 ¡ 63.3 ¡ 74.5 ¡ 73.1 ¡ 65.7 ¡ 2015-‑16 ¡ 2016-‑17 ¡ State ¡
Indicator ¡Percentage ¡Changes ¡ 2015-‑2016 ¡ 2016-‑2017 ¡ 3 rd ¡Grade ¡ELA ¡ 68% ¡ 80% ¡ 3 rd ¡Grade ¡Math ¡ 73% ¡ 80% ¡ 4 th ¡Grade ¡ELA ¡ 75% ¡ 80% ¡ 4 th ¡Grade ¡Math ¡ 72% ¡ 80% ¡ 4 th ¡Grade ¡SS ¡ 75% ¡ 80% ¡ 5 th ¡Grade ¡ELA ¡ 73% ¡ 80% ¡ 5 th ¡Grade ¡Math ¡ 74% ¡ 80% ¡ 5 th ¡Grade ¡Science ¡ 71% ¡ 80% ¡ 6 th ¡Grade ¡ELA ¡ 74% ¡ 80% ¡ 6 th ¡Grade ¡Math ¡ 74% ¡ 80% ¡ 6 th ¡Grade ¡Soc. ¡St. ¡ 68% ¡ 80% ¡ 7 th ¡Grade ¡ELA ¡ 74% ¡ 80% ¡ 7 th ¡Grade ¡Math ¡ 74% ¡ 80% ¡
Indicator ¡Percentage ¡Changes ¡ 2015-‑2016 ¡ 2016-‑2017 ¡ 8 th ¡Grade ¡ELA ¡ 74% ¡ 80% ¡ 8 th ¡Grade ¡Math ¡ 66% ¡ 80% ¡ 8 th ¡Grade ¡Science ¡ 70% ¡ 80% ¡ Algebra ¡I ¡ 72% ¡ 80% ¡ Geometry ¡ 80% ¡ 80% ¡ ELA ¡I ¡ 77% ¡ 80% ¡ ELA ¡II ¡ 78% ¡ 80% ¡ Us ¡History ¡ 76% ¡ 80% ¡ Government ¡ 74% ¡ 80% ¡ Biology ¡ 72% ¡ 80% ¡
Progress ¡Component ¡
Gap ¡Closure: ¡ ¡AMOs ¡
Gradua3on ¡Rate ¡
Comparison ¡of ¡Gradua3on ¡Rate ¡ ¡ 2015-‑2016 ¡ 2016-‑2017 ¡ State ¡ 4 ¡year ¡gradua3on ¡ 85.5 ¡(C) ¡ 87.7 ¡(C) ¡ 83.4 ¡ rate ¡ 5 ¡year ¡gradua3on ¡ 90.2 ¡(B) ¡ 90.3 ¡(B) ¡ 85.6 ¡ rate ¡
K-‑3 ¡Literacy ¡
Prepared ¡for ¡Success ¡
Prepared ¡for ¡Success ¡
Similar ¡Districts ¡ District ¡ Achieve-‑ Progress ¡ Gradua=on ¡ K-‑3 ¡ Prepared ¡ Gap ¡ ment ¡ Rate ¡ Literacy ¡ for ¡ Closing ¡ Success ¡ Parma ¡ D ¡ F ¡ C ¡ C ¡ D ¡ F ¡ Willoughby D ¡ B ¡ B ¡ C ¡ D ¡ F ¡ -‑Eastlake ¡ Cuyahoga ¡ D ¡ B ¡ B ¡ C ¡ D ¡ F ¡ Falls ¡ Lakewood ¡ C ¡ B ¡ C ¡ C ¡ D ¡ F ¡ Berea ¡ D ¡ F ¡ B ¡ C ¡ C ¡ F ¡ Mentor ¡ C ¡ A ¡ A ¡ C ¡ C ¡ C ¡ Elyria ¡ D ¡ F ¡ C ¡ D ¡ F ¡ F ¡ Brunswick ¡ C ¡ A ¡ A ¡ C ¡ C ¡ C ¡
Career-‑Technical ¡
Watch ¡Schools ¡ We ¡have ¡been ¡in ¡Safe ¡Harbor ¡since ¡the ¡ 2013-‑2014 ¡school ¡year. ¡ ¡With ¡the ¡ implementa3on ¡of ¡ESSA ¡which ¡replaced ¡No ¡ Child ¡Le^ ¡Behind, ¡the ¡State ¡has ¡not ¡included ¡any ¡ guidance/processes ¡for ¡the ¡watch ¡school ¡ designa3ons. ¡ ¡The ¡district ¡will ¡con3nue ¡to ¡ monitor ¡student ¡growth ¡through ¡the ¡Ohio ¡ Improvement ¡Process. ¡ ¡
Recommend
More recommend