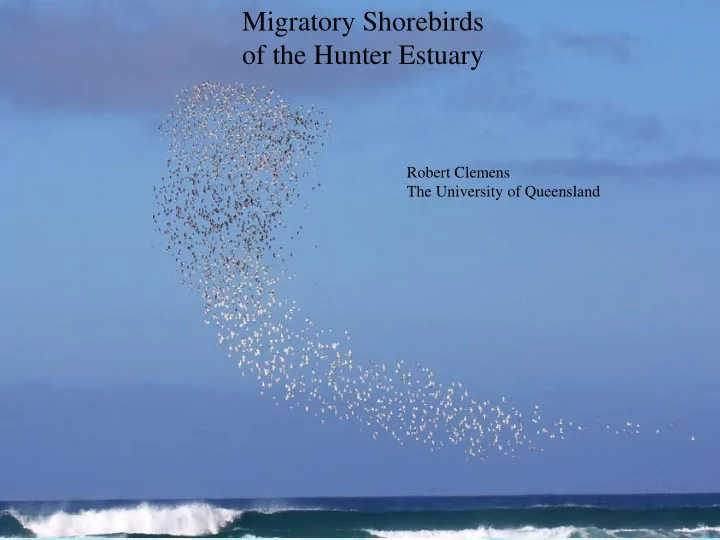

Migratory Shorebirds of the Hunter Estuary Robert Clemens The University of Queensland
Hunter Estuary Ramsar Site Ramsar wetlands are listed as a Matter of National Environmental Significance ( MNES under the EPBC Act Hunter meets Criterion 4 – supports animals at a critical life stage Chris Tzaros and Criterion 6 - regularly supports 1% of the individuals in a population of one species of waterbird. Glenn Ehmke
International agreements to protect these birds • Bonn Convention • CAMBA China-Australia Migratory Bird Agreement • JAMBA Japan-Australia Migratory Bird Agreement • ROKAMBA Republic of Korea-Australia Migratory Bird Agreement
• All shorebirds are listed as MNES under the EPBC Act • Curlew Sandpiper listed as Endangered under the Threatened Species Conservation Act 1995 (NSW) ( TSC Act ). • Both the Eastern Curlew and Great Knot are also listed as Vulnerable on the IUCN’s Red List.
Impacts are considered significant under MNES for shorebirds and Ramsar sites if: • An action destroys habitat • Disrupts the life cycle of a migratory species • Seriously affects invertebrates
How do we know what a significant impact is? • RAMSAR ECD’s set limits of acceptable change for the Hunter – record no fewer than 5,000 shorebirds or 600 Eastern Curlew for 5 yrs • EPBC has significant impact guidelines: – Won’t impact more than 0.1% of the flyway population – Will consider the entire area of habitat which may include multiple roosts and feeding areas
These levels of significant impact have been exceeded repeatedly in the Hunter Estuary But no action has been taken to reduce impacts, and the T4 project is likely to exacerbate ongoing impacts
Snipe Tzaros Sandpipers Tzaros Knots Clemens Oystercatchers Curlews Stints What is a Clemens shorebird? Ingwersen Clemens Pratincoles Ehmke Godwits Avocets Plovers Tzaros Ingwersen Ingwersen
Migratory species vary in size and moult twice a year From a: Red-necked Stint • Body size of a sparrow • Weigh 25 grams (½ bag of chips) Ingwersen Ingwersen Ehmke Jeff Davies Tzaros Tzaros Ingwersen To a: Eastern Curlew --- Over 1 kilogram 3-5 million migratory shorebirds visit Australia Adrian Boyle annually
Shorebird species in Australia 18* residents Hooded Plovers by Glenn Ehmke 37 migrants Eastern Curlew by Glenn Ehmke 24 vagrants * The Australian Pratincole is known to migrate to islands north of Australia Dunlin by Alexandre Andreev
East Asian-Australasian flyway Birds breed in Siberia, North China and Alaska in June and July Joe Liebezeit Stopover at staging sites in Yellow Sea Ken Gosbell Migrate south to Australia & New Zealand Danny Rogers
Ruddy Turnstone migration – tracked with geo-locators
Where do they breed? • Sandpipers, godwits, some plovers, tattlers and turnstones breed in the arctic tundra • Marsh Sandpiper, Greater Sand Plover and Oriental Plover breed in the steppes and deserts of middle latitudes • Shanks breed in the belt of boreal forests across the northern Hemisphere Emily Weiser
Different bills allow different shorebird species to capture different prey Ehmke Ingwersen Clemens Herrod Rogers Tzaros Rogers Ingwersen Rogers Ingwersen
Polychaetes Examples of shorebird prey items Gastropod – Salinator fragilis Crustacea – Amphipod sp. Pictures – Sabine Dittmann
The energetics of migration • Pre-migration, Seasonal variation in weight of Red-necked Stints body mass increases by up to 70-80%. 2-5% weight gain per day Rogers et al . (1996). The Stilt 29 , 2-23. Clemens
The Hunter Estuary, New South Whales
Australia’s nationally important shorebird sites
Shorebird Trends, at individual sites Shorebird species Rates of decline % per year (bold = significant result) Moreton Bay, Qld Corner Inlet, Vic NE, Tasmania Wilson et al. (2011) Cons. Biol. Minton et al. (2012) Stilt Cooper et al. (2012) Stilt Curlew Sandpiper -3.4% 3.4% -2.9% 2.9% -4.0% Eastern Curlew -2.1% .1% -2.2% .2% -2.2% Great Knot -4.4% .4% -3.2% .2% NA Red Knot -9.1% .1% -3.2% .2% NA Ruddy Turnstone -6.1% .1% -3.2% .2% -2.1% .1% Greenshank -5.9% .9% -2.6% .6% 1.6% Bar-tailed Godwit -6.4% .4% -2.4% .4% 0.7%
1 100 2 1 2 3 27 6 5 59 4 5 6 7 4 14 8 6 5 7 Eastern Curlew 8 Takuya Iwamura – University of Queensland
1975: Low Tide
1. How much intertidal habitat is left? 2010: Low Tide 2. What is the rate of loss? 3. What are the primary drivers of loss?
Spatially variable pattern of past habitat loss
Shorebirds declining more rapidly at the Hunter than most other places in Australia N = 229 shorebird areas throughout Australia, more birds are disappearing from the Hunter Estuary over the last 30 years than 75%+ of the other shorebird areas in Australia
What’s most likely Less Food caused declines changes in water quality, sediment More disturbance How will we respond Photo: Dean Ingwersen
Conclusions T4 project likely to exacerbate ongoing shorebird declines with increased indirect impacts - disturbance and degraded foraging habitat indirect impacts not addressed in assessment documents T4 will directly impacts nationally significant numbers of birds Tomango offset will not offset indirect impacts, and is not guaranteed to work in the long-term Eastern Curlew by Glenn Ehmke
Thank you
Recommend
More recommend