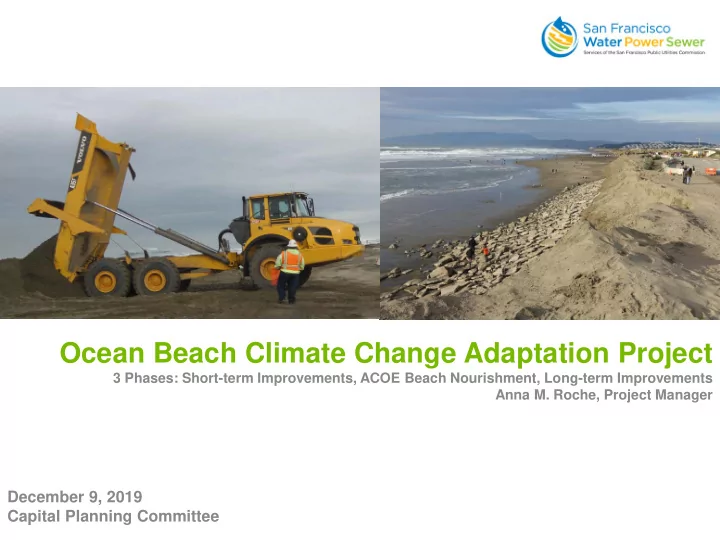

Ocean Beach Climate Change Adaptation Project 3 Phases: Short-term Improvements, ACOE Beach Nourishment, Long-term Improvements Anna M. Roche, Project Manager December 9, 2019 Capital Planning Committee
1. PROJECT DRIVERS Wastewater Facilities & Infrastructure – Ocean Beach Protection | Grey. Green. Clean. 2 2
Wastewater Infrastructure at Risk westside force main oceanside treatment plant Wastewater Facilities & Infrastructure – Ocean Beach Protection | Grey. Green. Clean. 3
Project Drivers Existing Vulnerability of LMT - HIGH • Short-term Improvements only partially mitigate risk • 25-year storm event could result in 40 feet of erosion • Current bluff toe is within 50 feet of Trigger Distance Wastewater Facilities & Infrastructure – Ocean Beach Protection | Grey. Green. Clean. 4
Project Drivers OBMP Guiding Principles • Managed Retreat / Adaptive Management • Beach Nourishment • Structural Protection • Access & Recreation SF Planning Adopts Local Coastal Program Update • Adopts policy supporting OBMP guiding principles Terms of 2014 Litigation Settlement • Implement short-term project to enhance recreation • Implement long-term adaptive management project • Protect natural resources/sensitive species • Remove emergency armoring Terms of 2015 Coastal Permit for Short-term • Requires an application by December 2021 Wastewater Facilities & Infrastructure – Ocean Beach Protection | Grey. Green. Clean. 5
2. PROJECT HISTORY Wastewater Facilities & Infrastructure – Ocean Beach Protection | Grey. Green. Clean. 6 6
Project History: Chronic Erosion Wastewater Facilities & Infrastructure – Ocean Beach Protection | Grey. Green. Clean. 7
Historic Approaches to Erosion Wastewater Facilities & Infrastructure – Ocean Beach Protection | Grey. Green. Clean. 8
3. SHORT-TERM IMPROVEMENTS Wastewater Facilities & Infrastructure – Ocean Beach Protection | Grey. Green. Clean. 9 9
Wastewater Facilities & Infrastructure – Ocean Beach Protection | Grey. Green. Clean. 10
Short-term Improvements 2011 Sand Bags • 100-feet in a localized notch 2012 Sand Placement • 77,000 cubic yards 2014 Sand Placement (with new permit) • 22,500 cubic yards 2016 Sand Placement • 70,000 cubic yards 2017 Sand Placement • 65,000 cubic yards + 300 sand bags 2019 Sand Placement (on-going) • 60,000 cubic yards & sand bag maintenance Wastewater Facilities & Infrastructure – Ocean Beach Protection | Grey. Green. Clean.
4. ACOE BEACH NOURISHMENT Wastewater Facilities & Infrastructure – Ocean Beach Protection | Grey. Green. Clean. 12 12
ACOE Beneficial Use of Dredged Material as Sand Nourishment • Army Corps of Engineers, Section 204 Beneficial Use of Dredged Material • Requires a Local Sponsor (SFPUC) • Requires Cost Share Agreement 35% to 65% split $2.8 M for 350,000 cubic yards NOTE: $1.3 M for 70,000 cubic yards in 2016 • Design Agreement Signed June 2019 & Funds Provided ($280k) • Anticipate Implementation in 2021 Wastewater Facilities & Infrastructure – Ocean Beach Protection | Grey. Green. Clean.
5. LONG-TERM IMPROVEMENTS Wastewater Facilities & Infrastructure – Ocean Beach Protection | Grey. Green. Clean. 14 14
PUC and Non-PUC Elements PUC – Structural Protection • Low-profile wall • SFPUC Service Road • Recontour and revegetate bluff • Remove shoreline armoring MTA + RPD – Coastal Access & Recreation (design by PW) • Coastal Access Trail & Beach Access • Public Bathroom • Coastal Parking • Intersection Improvements • Maintain Access to SF Zoo Parking Lot Wastewater Facilities & Infrastructure – Ocean Beach Protection | Grey. Green. Clean. 15
Project Elements Wastewater Facilities & Infrastructure – Ocean Beach Protection | Grey. Green. Clean. 16
6. PROJECT BUDGET AND SCHEDULE Wastewater Facilities & Infrastructure – Ocean Beach Protection | Grey. Green. Clean. 17 17
Long-term Improvements Only Construction Costs Comparison AAR CER VARIANCE *PUC Base Construction $67,892,366 $98,540,689 **$30,648,323 ***Non-PUC Base $0 $16,350,485 $16,350,485 Construction Design/Estimating $15,430,083 $22,718,349 $7,288,266 Contingency Construction Contingency $8,332,245 $13,760,953 $5,428,708 Total $91,654,693 $151,370,476 $59,715,782 * Cost includes Bonds & Insurance, Escalation, and Profit **Construction schedule extends from 28 to 46 months, updated escalation rates add $15.5M, and profit increases add $13M ***Non-PUC Components total approximately $22M with Design and Construction Contingency added Wastewater Facilities & Infrastructure – Ocean Beach Protection | Grey. Green. Clean. 18
Ocean Beach Project Schedule VARIANCE BASELINE FORECAST PHASE* (Forecast – FINISH FINISH Baseline) *Project Management January 2026 July 2027 + 19 Months Planning June 2019 September 2019 + 3 Months Environmental October 2022 October 2022 --- Design September 2021 December 2021 + 3 Months Bid and Award December 2022 December 2022 --- Construction July 2025 January 2027 + 18 Months Construction Management July 2025 January 2027 + 18 Months Closeout January 2026 July 2027 + 18 Months * Construction Schedule extended by 18 months Wastewater Facilities & Infrastructure – Ocean Beach Protection | Grey. Green. Clean. 19
5. Q & A Wastewater Facilities & Infrastructure – Ocean Beach Protection | Grey. Green. Clean. 20 20
Discussion / Questions Wastewater Facilities & Infrastructure – Ocean Beach Protection | Grey. Green. Clean. 21
Recommend
More recommend