Objectives Temperature TMDLs Present steps used to produce a - - PDF document

objectives
SMART_READER_LITE
LIVE PREVIEW

Objectives Temperature TMDLs Present steps used to produce a - - PDF document

5/22/2012 Potential Natural Vegetation Objectives Temperature TMDLs Present steps used to produce a temperature TMDL based on riparian shade. Discuss the Priest Lake Subbasin PNV temperature TMDLs. Mark Shumar, State Technical


slide-1
SLIDE 1

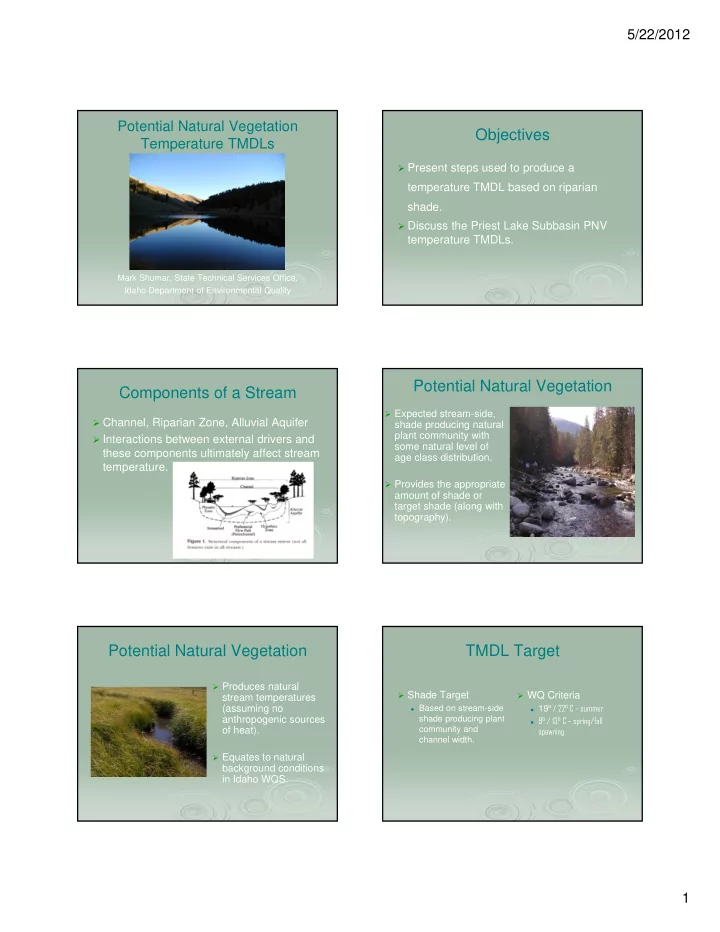
5/22/2012 1 Potential Natural Vegetation Temperature TMDLs

Mark Shumar, State Technical Services Office, Idaho Department of Environmental Quality

Objectives

  • Present steps used to produce a

temperature TMDL based on riparian shade.

  • Discuss the Priest Lake Subbasin PNV

temperature TMDLs.

Components of a Stream

  • Channel, Riparian Zone, Alluvial Aquifer
  • Interactions between external drivers and

these components ultimately affect stream temperature.

Potential Natural Vegetation

  • Expected stream-side,

shade producing natural plant community with some natural level of age class distribution.

  • Provides the appropriate

amount of shade or target shade (along with topography).

Potential Natural Vegetation

  • Produces natural

stream temperatures (assuming no anthropogenic sources

  • f heat).
  • Equates to natural

background conditions in Idaho WQS.

TMDL Target

  • Shade Target

 Based on stream-side

shade producing plant community and channel width.

  • WQ Criteria

 19° / 22° C – summer  9° / 13° C – spring/fall

spawning

slide-2
SLIDE 2

5/22/2012 2

Temperature TMDL

  • Loading Capacity = Solar Load under PNV

aka target shade

  • Existing Load = Solar Load under current

(existing) shade

  • Load Reduction = PNV Load – Existing Load

Existing Shade (aerial

interpretation)

Existing Shade Field Verification

Channel Width natural & existing

slide-3
SLIDE 3

5/22/2012 3

Idaho Regional Curves - Bankfull Width

y = 5.64x0.52 R2 = 0.95 y = 6.66x0.50 R2 = 0.84 y = 4.87x0.53 R2 = 0.89 y = 8.37x0.40 R2 = 0.96 y = 9.83x0.38 R2 = 0.79 y = 8.23x0.48 R2 = 0.92 y = 5.14x0.44 R2 = 0.76 1 10 100 1000 1 10 100 1000 10000 100000 Drainage Area (mi2) Bankfull Width (ft) Clearwater Kootenai Payette/Weiser Pend Oreille Salmon Spokane Upper Snake

Bankfull Width Estimation

Location area (sq mi) Spokane (m) Kootenai (m) PendOreille (m) Clearwater (m) BURP Data (m) Kent Creek @ mouth 3.71 5 4 4 3 South Fork Lion Creek @ mouth 4.58 5 4 5 4 Lucky Creek @ mouth 1.66 3 3 3 2 Lion Creek @ mouth 28.48 13 11 10 10 17.2 Lion Cr ab Lucky Creek 26.39 12 10 9 9 Lion Cr ab South Fork Lion Cr 21.04 11 9 9 8 Lion Cr ab 6th tributary 15.86 9 8 8 7 Lion Cr ab 2nd tributary 11.7 8 7 7 6 Lion Cr ab Kent Creek 7.23 6 5 6 5 Lion Cr ab 1st tributary 3.04 4 4 4 3

Target Shade

Shade Calculator (Shade.xls, WA DOE)

Shade Production

Forest Shade Curves

Table 1. VRU/HTG Assessment Groups in the Pend Oreille Basin (KPIZ 2003) Assessment Group Description Group A:

VRU 1/HTG 1 (Warm/Dry), VRU 2/HTG 2 (Moderately Warm/Dry), and VRU 3/HTG 3 (Moderately Warm/ Moderately Dry). This group contains the more warm and dry habitat types with VRU 1 being the warmest and driest to the more moderate conditions of VRU 3. These sites include warm, dry grasslands to moderately cool and dry upland sites. The dry, lower elevation open ridges are composed of mixed Douglas-fir and ponderosa pine in well-stocked and fairly open-grown conditions. Moderately moist, upland sites and dense draws also include larch and lodgepole pine, with lesser amounts of ponderosa pine. Tree regeneration occurs in patches and is largely absent in the understory, particularly in the driest sites. Annual precipitation ranges from 14” to 30”, about 75% of that falling as rain. While the growing season is fairly long, high solar input and moderately shallow soils often result in soils that dry out early in the growing season, which results in low to moderate site productivity. Group B: VRU 4/HTG 4 (Moderately Warm/Moist), VRU 5/HTG 5 (Moderately Cool/Moist), and VRU 6/HTG 6 (Moderately Cool/Wet). This group occupies most of the moist sites along benches and stream

  • bottoms. The moderating effects of the inland maritime climate ecologically

influence this group. This group includes the more moderate sites of VRU 4 and scattered riparian and wet sites of VRU 6. This group is widespread throughout the forest and has the most biological productivity. Precipitation is moderate to high ranging from 30” to 55” per year. Group C: VRU 7/HTG 7 (Cool/Moist) and VRU 8/HTG 8 (Cool/Wet). This group occurs in the moist, lower subalpine forest setting and is common

  • n northwest to east facing slopes, riparian and poorly drained subalpine sites,

and moist frost pockets. This landscape is typically bordered by warmer sites (Group B) and cool, drier subalpine sites (Group D). This group includes characteristics of each. Average precipitation is estimated between 35” and 55” per year, less than half as rain. Vegetative productivity is moderate to high as a result of the high moisture-holding capacity and nutrient productivity of loess deposits, adequate precipitation, and a good growing season. Group D: VRU 9/HTG 9 (Cool/ Moderately Dry), HTG 10 (Cold/Moderately Dry) and HTG 11 (Cold). This group is typified by cool and moderately dry conditions with moderate solar input. The climate is characterized by a short growing season with early summer frosts. Annual precipitation ranges from 35”-70”, mostly in the form

  • f snow. Due to generally shallow soils (low water holding capacity), slope

position, and aspect, soil moisture is often limited during late summer months. It is generally found on rolling, ridges and upper reaches of convex mountain slopes.

slide-4
SLIDE 4

5/22/2012 4

Table 4. IPNF Historical Forest Vegetation Composition Estimates

Assessment Group

PP WP WL DF GF/WH WRC LP SAF WBP Kaniksu NF Warm/Dry (Group A) 67%

  • -

10% 15%

  • -
  • -

8%

  • -
  • -

Moist (Group B) 1% 39% 27% 13% 5% 7% 4% 5%

  • -

Cool/Moist (Group C)

  • -

13% 12% 1%

  • -
  • -

12% 63%

  • -

Cool/Dry (Group D)

  • -
  • -
  • -
  • -
  • -
  • -

18% 63% 19% Table 7. IPNF Historical Forest Vegetation Size Class Structure Estimates Assessment Group

% of Area Shrub/Seed/ SAP Small/ Pole Medium/ Immature Large/ Mature “Oldest”

Kaniksu NF Warm/Dry (Group A) 11% 21% 10% 13% 16% 41% Moist (Group B) 62% 22% 13% 22% 22% 20% Cool/Moist (Group C) 19% 21% 12% 22% 24% 21% Cool/Dry (Group D) 7% 22% 13% 22% 23% 20% Forest Vegetation Height - Tree height conditions for the individual trees which comprise each forest were calculated using a component of the Forest Vegetation Simulator (FVS), which is an individual tree growth and yield model . Tree heights are calculated by the FVS based on size class information provided in Table 10. Two variants of this model were used during this analysis Idaho Panhandle, Clearwater, and Nez Perce National Forests - The “Northern Idaho/Inland Empire” Height-Diameter relationship variants were used to estimate tree heights for forest vegetation in the Idaho Panhandle, Clearwater, and Nez Perce National Forests. Specifically, tree height was calculated as: HT = 4.5 + e^[a + b/(dbh+1)]; where HT is the total tree height in feet, dbh is the tree diameter at breast height, and a and b are species specific coefficients ...

Table 10. Summary size class information associated with Range of Variability Analysis Summary Information Target IPNF

1

CWNF/NPNF

2

BNF/PNF/SNF

3

IPNF CWNF NPNF BNF PNF SNF Size Class Year Class dbh Size Class Year Class Size Class dbh dbh dbh dbh Seed/Sap 0 - 40 0–5 0 – 6” dbh 1 - 40 Seed/Sap 0.1 – 5

3” 3” 3”

Small 40 – 70 5–10 6 – 14” dbh 41 – 100 Small 5 – 12

8” 10” 9”

Medium 70 - 100 10–15

  • -
  • -

Medium 12 – 20

13”

  • -

16”

Large 100 + > 15 Mature 101 - 150 Large > 20

19” 19” 24”

“Oldest”4

  • -
  • -

Over- mature 150 +

  • -
  • -

24” 24”

  • -

Table 12. Height (feet) based on Height-Diameter Relationships in the NI Variant. Common Name dbh (Inches) 3 8 10 13 19 24

Western white pine 22 69 83 98 119 130 Western larch 31 73 83 94 108 115 Douglas-fir 24 59 68 78 90 97 Grand fir 24 64 75 87 103 112 Western hemlock 23 63 73 85 100 109 Western red cedar 21 57 67 78 92 100 Lodgepole pine 31 61 67 74 82 87 Engelmann spruce 22 59 69 80 95 103 Subalpine fir 22 55 63 73 85 91 Ponderosa pine 18 54 64 75 91 100 Mountain hemlock 16 47 56 66 79 87 Whitebark pine 31 73 83 94 108 115 Limber pine 23 42 46 50 56 58 Subalpine larch 22 55 63 73 85 91 Pinyon pine 23 42 46 50 56 58 Rocky Mountain Juniper 23 42 46 50 56 58 Pacific Yew 23 42 46 50 56 58 Quaking Aspen 21 46 51 58 66 70 Cottonwood 21 46 51 58 66 70 Rocky Mountain maple 21 46 51 58 66 70 Paper birch 21 46 51 58 66 70 Other hardwoods 21 46 51 58 66 70 Other softwoods 16 47 56 66 79 87

slide-5
SLIDE 5

5/22/2012 5

Table 13. Vegetation Height Summary Condition for Kaniksu National Forest. Vegetation Size Class Groups Alpha Code – Common Name Sapping Small Medium Large Oldest Group A (Warm/Dry) PP - Ponderosa Pine

2.5 3.6 6.6 9.8 27.4 WP - Western White Pine

  • -
  • -
  • -
  • -
  • -

WL - Western Larch 0.7 0.7 1.2 1.7 4.7 DF - Douglas Fir 0.8 0.9 1.5 2.2 5.9 GF/WH - Grand Fir/ Western Hemlock

  • -
  • -
  • -
  • -
  • -

WRC - Western Red Cedar

  • -
  • -
  • -
  • -
  • -

LP - Lodgepole Pine 0.5 0.5 0.8 1.1 2.8 SAF - Subalpine Fir

  • -
  • -
  • -
  • -
  • -

WBP - White Bark Pine

  • -
  • -
  • -
  • -
  • -

Group A Height Sub-Totals 4.5 5.7 10.1 14.7 40.9 Total 76 Group B (Moist) PP - Ponderosa Pine 0.0 0.1 0.2 0.2 0.2 WP - Western White Pine 1.9 3.5 8.4 10.2 10.1 WL - Western Larch 1.8 2.5 5.6 6.4 6.2 DF - Douglas Fir 0.7 1.0 2.2 2.6 2.5 GF/WH - Grand Fir/ Western Hemlock 0.3 0.4 0.9 1.1 1.1 WRC - Western Red Cedar 0.3 0.5 1.2 1.4 1.4 LP - Lodgepole Pine 0.3 0.3 0.7 0.7 0.7 SAF - Subalpine Fir 0.2 0.4 0.8 0.9 0.9 WBP - White Bark Pine

  • -
  • -
  • -
  • -
  • -

Group B Height Sub-Totals

5.6 8.7 20.0 23.5 23.1

Total 81

Canopy Cover

Table 19 (continued). Weighted Average Canopy Cover for Biophysical Setting Groups Biophysical Setting 1010460

Northern Rocky Mountain Subalpine Woodland and Parkland

Description Composition (%) Canopy Cover Low Range Canopy Cover High Range Target - 75th Percentile Value Weighted Condition

Early Development

20 100 75 15

Mid Development Closed

40 31 100 83 33

Mid Development Open

15 30 23 3

Late Development Open

5 40 30 2

Late Development Closed

20 41 100 85 17 Total 70 Biophysical Setting 1010471

Northern Rocky Mountain Mesic Montane Mixed Conifer Forest

Description Composition (%) Canopy Cover Low Range Canopy Cover High Range Target - 75th Percentile Value Weighted Condition

Early Development

15 100 75 11

Mid Development Closed

30 61 100 90 27

Mid Development Open

5 60 45 2

Late Development Open

10 60 45 5

Late Development Closed

40 61 100 90 36 Total 81

Forest Shade Curves Non-Forest (“Hardwood”) Type

slide-6
SLIDE 6

5/22/2012 6

Non-Forest Group 1

Revised October 2009

http://www.deq.idaho.gov/ media/528731-pnv_temp_ tmdl_manual_revised_1009. pdf

Target Shade (%) Lion Creek Loading Table

AU Stream Name Number (top to bottom) Length (m) Vegetation Type Shade Solar Radiation (kWh/m2/ day) Segment Width (m) Segment Area (m2) Solar Load (kWh/day) Shade Solar Radiation (kWh/m2/ day) Segment Width (m) Segment Area (m2) Solar Load (kWh/day) Excess Load (kWh/day) Lack of Shade 013_02 Lion Creek 1 360 Lake 0% 5.70 240 86,400 492,000 0% 5.70 240 86,400 492,000 0% 013_02 Lion Creek 2 1200 Group D 96% 0.23 2 2,000 500 90% 0.57 2 2,000 1,000 500

  • 6%

013_02 Lion Creek 3 290 Group D 92% 0.46 4 1,000 500 80% 1.14 4 1,000 1,000 500

  • 12%

013_02 Lion Creek 4 2100 Group C 94% 0.34 4 8,000 3,000 80% 1.14 4 8,000 9,000 6,000

  • 14%

013_02 Lion Creek 5 850 Group C 94% 0.34 4 3,000 1,000 70% 1.71 4 3,000 5,000 4,000

  • 24%

013_02 Lion Creek 6 390 Avalanche/Rock 50% 2.85 5 2,000 6,000 50% 2.85 5 2,000 6,000 0% 013_02 Lion Creek 7 1000 Group C 92% 0.46 5 5,000 2,000 80% 1.14 5 5,000 6,000 4,000

  • 12%

013_02 Lion Creek 8 1200 Group C 90% 0.57 6 7,000 4,000 90% 0.57 6 7,000 4,000 0% 013_02 Lion Creek 9 920 Group B 90% 0.57 7 6,000 3,000 80% 1.14 7 6,000 7,000 4,000

  • 10%

013_02 Lion Creek 10 4860 Group B 87% 0.74 8 40,000 30,000 50% 2.85 8 40,000 100,000 70,000

  • 37%

013_02 Lion Creek 11 1140 Group B 83% 0.97 9 10,000 10,000 50% 2.85 9 10,000 30,000 20,000

  • 33%

013_02 Lion Creek 12 450 Nonforest 52% 2.74 9 4,000 10,000 30% 3.99 9 4,000 20,000 10,000

  • 22%

013_02 Lion Creek 13 160 Group B 83% 0.97 9 1,000 1,000 70% 1.71 9 1,000 2,000 1,000

  • 13%

013_02 Lion Creek 14 1500 Group B 83% 0.97 9 10,000 10,000 80% 1.14 10 20,000 20,000 10,000

  • 3%

013_02 Lion Creek 15 360 Group B 83% 0.97 10 3,600 3,500 70% 1.71 12 4,300 7,400 3,900

  • 13%

013_02 Lion Creek 16 1130 Group B 83% 0.97 10 11,000 11,000 70% 1.71 17 19,000 32,000 21,000

  • 13%

013_02 Lion Creek 17 230 Nonforest 48% 2.96 10 2,300 6,800 20% 4.56 20 4,600 21,000 14,000

  • 28%

Totals

590,000 760,000 170,000

Segment Details Target Existing Summary

Shade Deficit (%) Implementation

  • Prioritize with Shade Deficit.
  • Field Verification – nature of problem and

pathfinder shade.

  • Problem identification – beaver ponds,

lack of water, plant community, channel width, disturbance (natural vs. human- caused).

  • Real opportunities for rehabilitation.