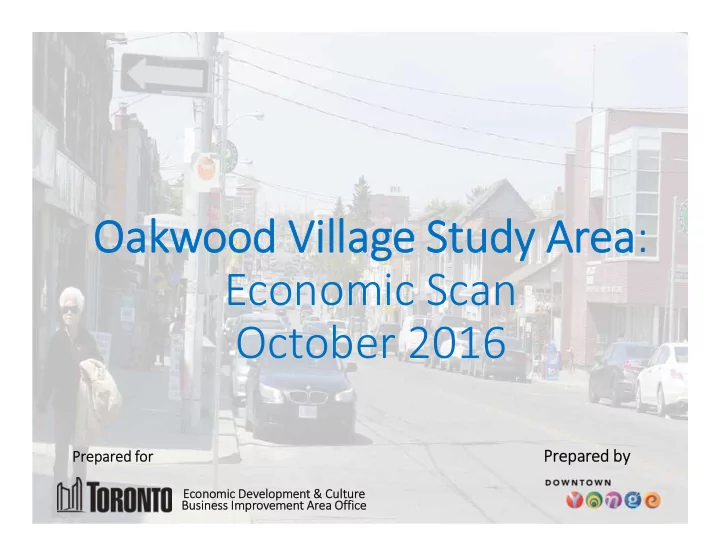

Oakwood Village Study Area : Economic Scan October 2016 Prepared by Prepared for Economic Development & Culture 1 Business Improvement Area Office
Property Assessment Value $34 million 31% increase since 2012 Oakwood Ave 2
What affects economic value? • Assets or pull factors • Bricks and mortar or experiential assets attract business, shoppers, visitors, tourists, residents • Liabilities or push factors • Bricks and mortar or experiential liabilities repel business, shoppers, visitors, tourists, residents DRAFT ONLY
Community Flowers Spaces Pull Factors Religious Organizations /Social Agencies 4
Vacancies Streetscape Push Factors Overall Area feel 5
What’s here and what is needed? What is What shops Who shops missing? are here? here? 6
Who shops here? Who lives here? • What do they spend their money on? • Who works here? • How many people come through the • neighbourhood daily? 7
100,000 people live here 6.3% Italian (2.7%)* 11% 39% 5.8% Portuguese 35-54 years Spanish Mother (2.2%)* old Tongue (43%)* (1.8%)* 4.7% Tagalog (2.3%)* 61% Average 1-2 Household persons/ Income Household $97,966 (51.8%)* ($104,378)* 8 Source: Environics Analytics, 2015 *Toronto CMA
100,000 people live here 53% Own 12% 47% work in Rent Education, (69% Own Law & social, 31% Rent)* community & government (7.8%)* 32% University 17% Degree work in Sales (31.7%)* & Service (15.8%)* 9 Source: Environics Analytics, 2015 *Toronto CMA
How do residents commute? Opportunities? 4% 47% 45% 3% 70%* 23%* 5%* 1%* Walk Score of 84/100! 10 Source: Environics Analytics, 2015; walkscore.com * Toronto CMA
What do residents spend money on? Shelter-20% (20%)* Transportation-15% (14%)* Food-10% (9%)* Household-8% (8%)* Recreation-5% (5%)* Clothing-4% (4%)* Health Care-3% (3%)* Other-35% (34%)* 11 Source: Environics Analytics, 2015 *Toronto CMA
Who works here? Who commutes here? Over 35,000 Daytime people ride the Population TTC through 15,921 the area daily! 12 Source: Environics Analytics, 2015 Source: Toronto Transit Commision, 2013, City of Toronto *8hr period, Count date: April 22, 2015
What shops are here? How many stores and what do • they sell? How many are vacant? • What clusters exist? • Is there enough parking? • 13
Of 77* stores on Oakwood Avenue; 15% 29% Business + Cafes, Restaurants, Professional Bars, Fast food Services 7% Education 15% Vacant 14 * Approximate based on street audit
Findings of the Economic Scan Potential shoppers vs current retail offering Potential shoppers Current retail offering • 98,584 residents within a • 77 stores with a strong focus on: 10 minute walk • Diverse bars/ restaurants/ grocery: Portuguese, • 15,921 daytime population Japanese, Cuban, Jamaican • 23% work from home • Business & professional • 24% work Part-time services: law offices, • 35,000 public transit riders accounting firms, paralegal daily services • Education: private schools, dance studios, daycares, driving schools 15 Source: Environics Analytics, 2015
Findings of the Economic Scan Retail types to Prioritize Home offices Business & Professional Services Ethnically diverse food & groceries (local vs visitor) What’s missing? 16
Global Retail Trends Capture the Appeal to Multiple young diverse Generations workforce populations “Aging in Place” Be Authentic & technologically Unique Retail relevant 17 Source: P.U.M.A Global Trends Report, 2016
Opportunities? • Potential to attract younger demographics, families with children & pets • Encourage over 15,000 daytime workers in the area to shop locally • Encourage local shopping by residents on foot, bike & transit • Encourage local stores to cross-promote & collaborate as clusters; promote district as a whole • Eg: Professional Services map • Collaborate with property owners, brokers to spark appropriate tenant recruitment Questions? 18
Recommend
More recommend